Figures & data
Figure 1. Changes in certain serotypes from IPD cases in Europe between 2010 and 2016, extracted from ECDC dataCitation6–11.
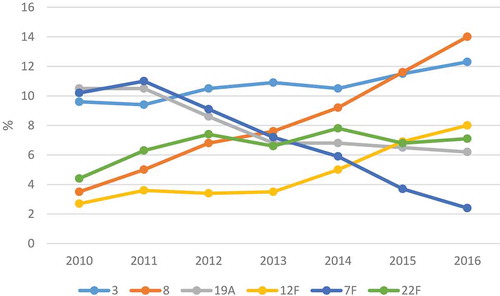
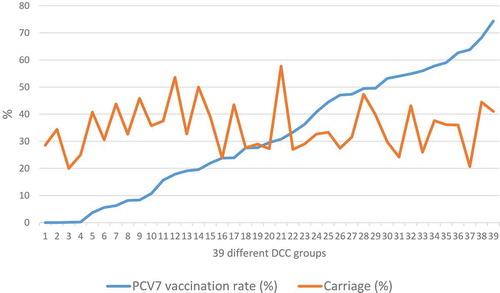
Figure 2. Despite increasing vaccination rate per DCC group, the carriage rate of the children remained essentially the sameCitation12.