
Figures & data
Figure 1. An NLP framework for HPV tweets analysis.
Figure 2. Example of sentiment analysis.
Figure 3. Example of entity extraction and analysis.
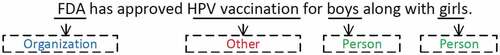
Table 1. Number of tweets of each year.
Figure 4. Boxplot of sentiment scores changes over 10 years.
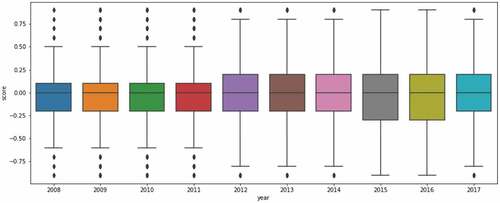
Figure 5. (a) Phrase cloud of positive tweets. (b) Phrase cloud of negative tweets.
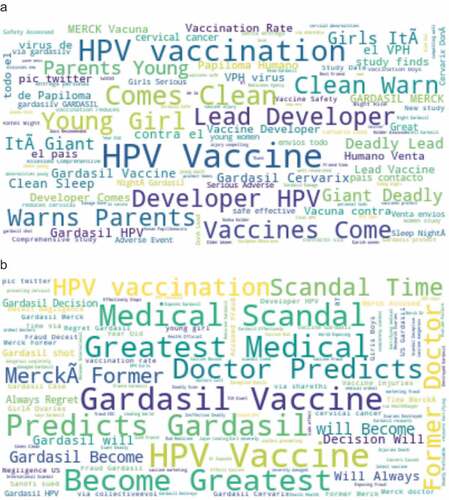
Table 2. Sample positive and negative tweets contain “CDC”, “FDA”, or “MERCK”.
Figure 6. Frequency of “CDC”, “FDA” and “Merck” in the positive and negative tweets.
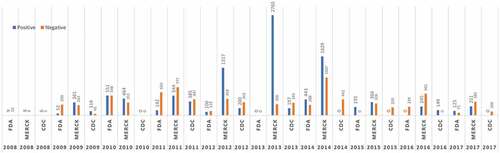
Table 3. Top frequent location entities in positive tweets.
Table 4. Top frequent location entities in negative tweets.
Table 5. Phrase association mining for negative tweets.
Table 6. Phrase association mining for positive tweets.