Figures & data
Figure 1. Vaccination with KEX1 induces a robust immune response. (a) Schematic representation of the vaccination strategy and treatment administration. (b) Mean reciprocal endpoint titer of anti-KEX1 IgG antibodies as determined by ELISA. Dotted lines on the X-axes indicate the times of vaccination. The period for administration of the immunosuppressive regimen is highlighted in grey. Dashed line indicates correlate of protection of 104 RET. (c) Ratio of KEX1 Antibody-secreting cells from total IgG-secreting cells, as determined by ELISpot. Mann–Whitney test was performed to evaluate the differences between the sham and vaccinated groups. *p < .05, **p < .01, ***p < .001.
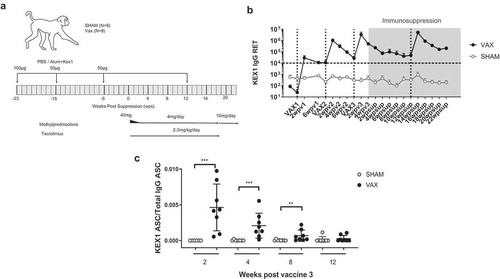
Figure 2. Monitoring during immunosuppression. (a) Tacrolimus levels were monitored every two weeks during treatment. Dotted line indicates the level of detection of 2 ng/ml, the dashed line indicates the target level of 5 ng/ml. (b-i) Changes in immune cell populations in the blood were monitored by flow cytometry. Frequency and absolute number of (b-c) CD3+ Lymphocytes, (d-e) CD4+ T cells, (f-g) CD8+ T cells and (h-i) B cells.
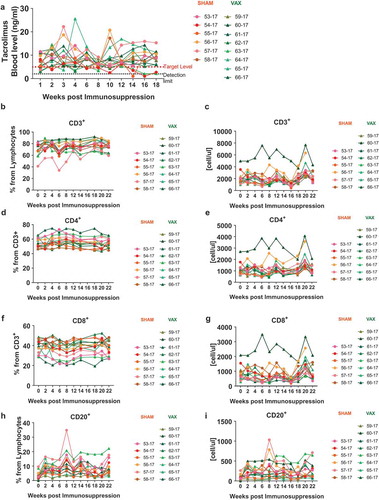
Figure 3. Colonization by Pneumocystis. Percentage of animals colonized with Pneumocystis was monitored by nested PCR in BAL samples, at monthly intervals. The difference between the sham and vaccinated groups was evaluated by repeated measures ANOVA and was found not to be significantly different.