
Figures & data
Figure 1. Map of study site, Jada Local Government Area, Adamawa State, Nigeria
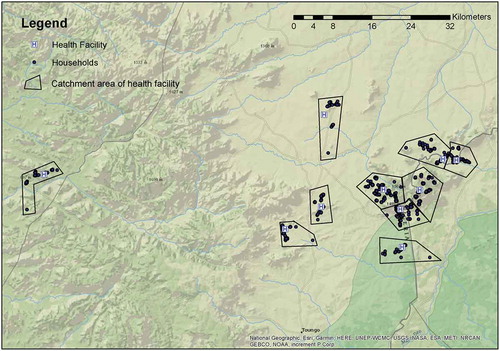
Table 1. Demographics of participants by study arm
Figure 2. Effect of cash incentives on Tetanus-toxoid Vaccination
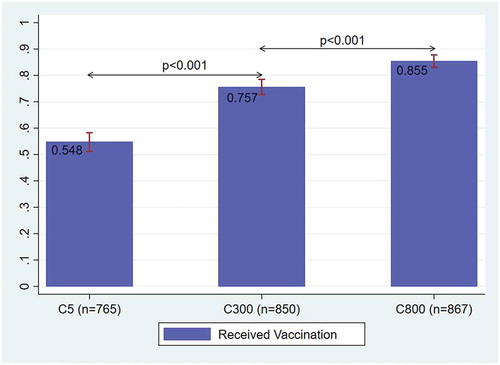
Table 2. Logistic regression analysis of CCT by transportation costs
Figure 3. Relationship between transportation costs and vaccination
Notes: The effect of transportation costs is estimated using a locally weighted regression.
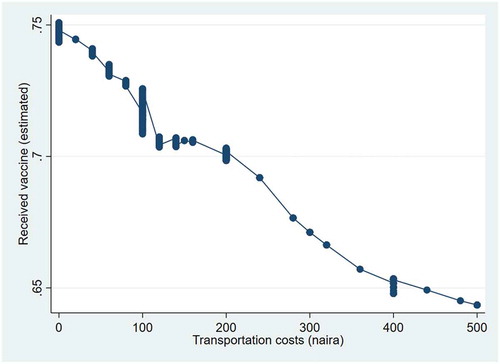
Table 3. Effects of CCT on transportation to clinic (Endline)