
Figures & data
Figure 1. Flow chart of subject enrollment in the test-negative case–control design study for estimating influenza vaccine effectiveness among children during school-based outbreaks during the 2016–2017 influenza season in Beijing, China.
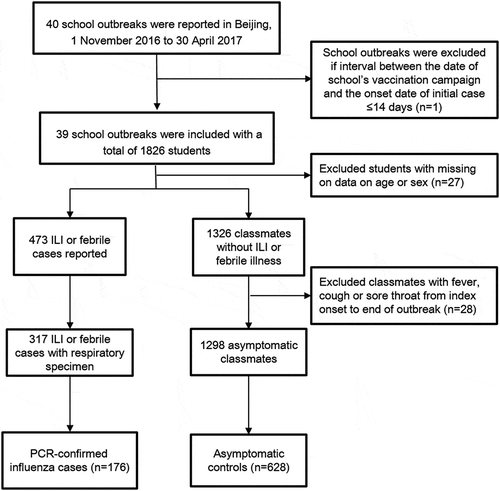
Figure 2. The time distribution of the eligible school influenza outbreaks included in the test-negative case–control study for estimating influenza vaccine effectiveness, 1 November 2016 Figure 1to 30 April 2017.
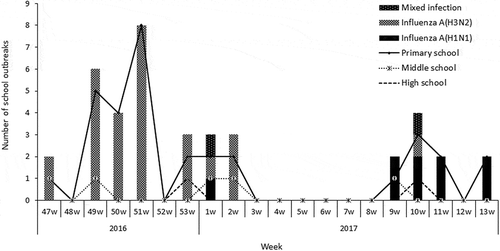
Table 1. Participant characteristics for estimates of influenza vaccine effectiveness for 2016–2017 trivalent influenza inactivated vaccine during school outbreaks of influenza in Beijing, 1 November 2016 to 30 April 2017.
Table 2. Estimates of vaccine effectiveness (VE) by age group and type of school during outbreaks of influenza in schools in Beijing, 1 November 2016 to 30 April 2017.
Table 3. Effect of previous vaccination on estimates of vaccine effectiveness (VE) in school outbreaks of influenza in Beijing, 1 November 2016 to 30 April 2017.