
Figures & data
Figure 1. Vaccination rate
Panel A: Vaccination rate by type of vaccine. Panel B: Vaccine Take-up and Dropout of DPT vaccine series. Panel C: Vaccine Take-up and Dropout of Polio vaccine series. Note: The sample is 27,478 children aged between 0 and 5 years old.
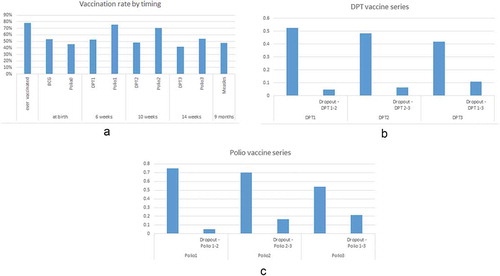
Table 1. Socio-demographic characteristics of sample (n = 21,369)
Table 2. Results of logistic regression for effect of distance on vaccine take-up
Table 3. Results of logistic regression for effect of distance on vaccine dropout
Table 4. Results of negative binominal regression for effect of distance on timing of vaccination