Figures & data
Figure 1. Delayed, durable, complete response of metastatic melanoma.
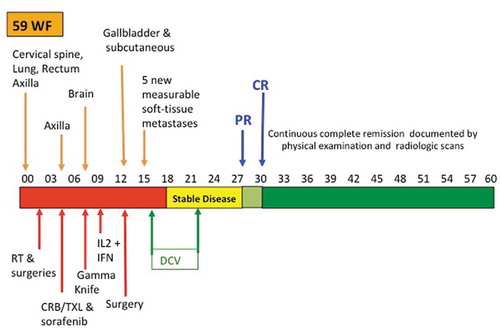
Table 1. Results of HLA-typing and for patient’s normal and malignant cells.a
Table 2. Summary of genomic analysis for the short-term cell lines.
Table 3. Mutated sites by numbers of mutations present in cells from autologous tumor cell line.
Table 4. Serum marker levels in relation to normal control values at week-0 baseline week-0 (1 week before first vaccine injection) and week-4 (1 week after third weekly vaccine injection) and percent change.
Table 5. Rankings of serum markers by baseline levels relative to control values, and greatest percent changes after three vaccine injections.
Figure 2. Summary of ELISPOT data.
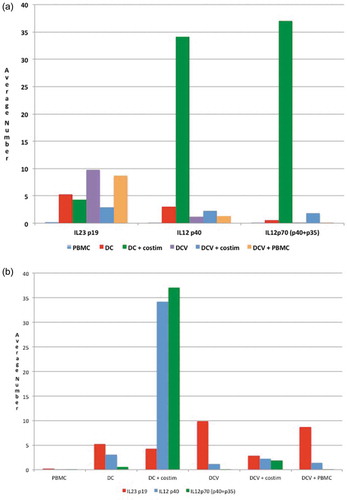
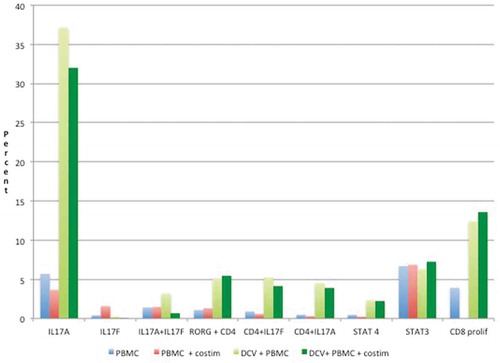
Figure 3. Expression of immune markers.