Figures & data
Figure 1. Decision tree model. A square node represents the decision node, a circular node represents a chance node and represents a Markov model. At the end of each branch of the decision tree there is one of three types of Markov models either corresponding to ⅰ. infants under immune ⅱ. infants have got perinatal infection or ⅲ. infants are susceptible. Under each line is a probability represented by P_; HBIG, hepatitis B immunoglobulin. If the tree is cloned, it means that the tree is copied, and a corresponding number will appear under the node of the tree.
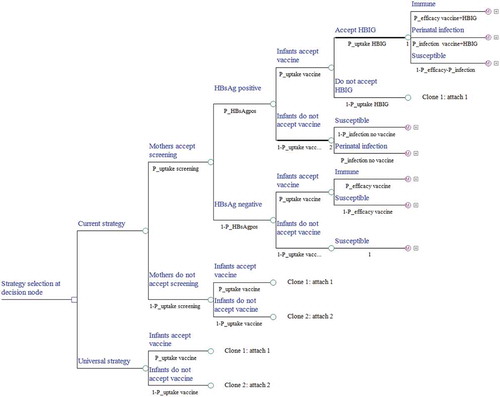
Table 1. Parameter values including ranges used in the sensitivity analyses.
Table 2. Transition probabilities for each cycle of the Markov model.
Table 3. New cases of HBV-related diseases and deaths in the birth cohort.
Table 4. Per capital costs, QALYs, and the ICERs of two strategies.
Figure 2. Markov model of protection.
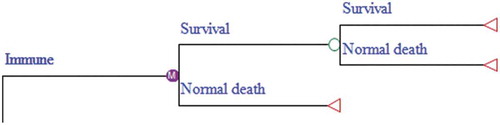
Figure 3. Markov model of perinatal infection and progression. A person in any state may die due to the other causes, but a person with decompensated cirrhosis or hepatocellular carcinoma may also die due to HBV infection.
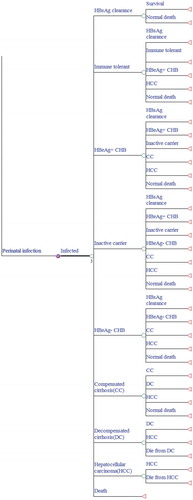
Figure 4. Markov model of hepatitis B virus (HBV) infection and progression. A susceptible individual would follow the HBV infection rate by age (see for the detail formula).
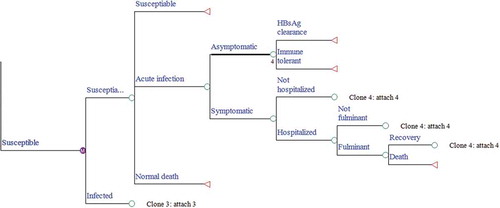
Figure 5. Tornado diagram presenting one-way sensitivity analyses. HepB3, 3-dose hepatitis B vaccination series. HBIG, hepatitis B immunoglobulin. HBsAg, hepatitis B surface antigen. QALY, quality-adjusted life year.
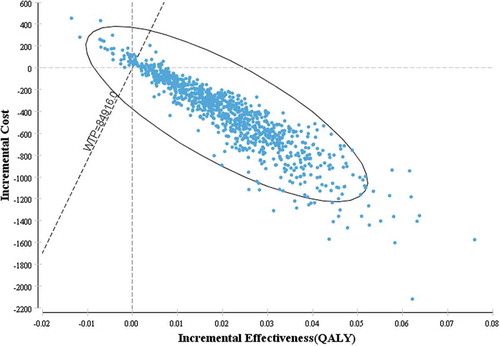
Figure 6. Incremental cost-effectiveness scatter plot for the current strategy compared to universal vaccination. WTP, willingness-to-pay threshold. QALY, quality-adjusted life year.