
Figures & data
Table 1. Comparison of baseline opsonophagocytic activity (OPA) for group B streptococcus (GBS) between risk groups.
Table 2. Comparison of baseline opsonophagocytic activity (OPA) for group B streptococcus (GBS) between risk groups: proportion in each range stratified by the magnitude of OPA titer.
Figure 1. Comparison of baseline opsonophagocytic activity (OPA) titers for group B streptococcus (GBS) between three age groups (upper panel, mean ± standard deviation; lower panel, point distribution): (a) serotype Ia, (b) serotype III, and (c) serotype V. NOTE: the same letters (alphabetical superscripts) indicate non-significant differences between groups based on Tukey’s multiple comparison tests.
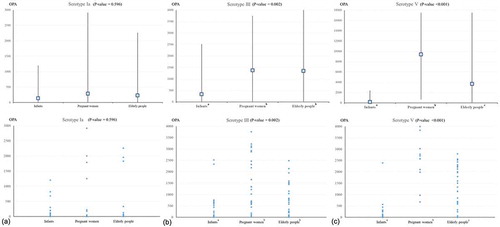
Table 3. Comparison of baseline opsonophagocytic activity (OPA) titers between group B streptococcus (GBS)-colonized and non-colonized pregnant women: proportion in each range stratified by the magnitude of OPA titer.
Table 4. Group B streptococcus (GBS) serotypes and opsonophagocytic activity (OPA) titers among four GBS-colonized pregnant women.
Figure 2. Comparison of baseline opsonophagocytic activity (OPA) titers for group B streptococcus (GBS) between GBS-colonized and GBS non-colonized pregnant women at their 35–37 weeks prenatal screening: distribution of OPA titers in each group (red circles, GBS-colonized women and blue circles, GBS non-colonized women).
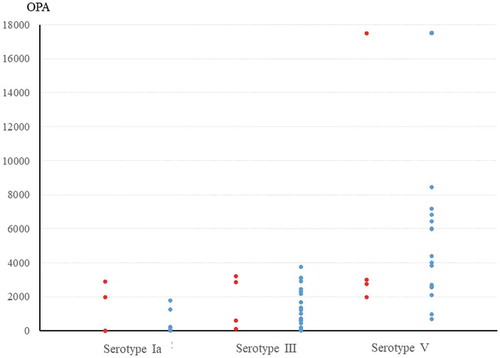
Table 5. Comparison of baseline opsonophagocytic activity (OPA) titers between preterm and full-term neonates/infants.