
Figures & data
Figure 1. Relative frequency histogram of log2 serum VNTs of the exploratory study (black bars) and the FIH vaccine trial (open bars).
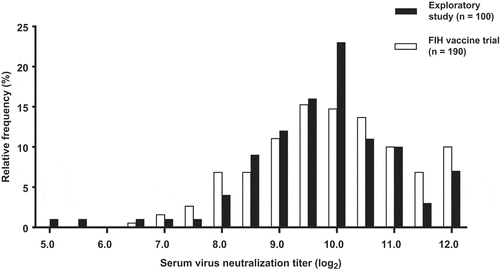
Figure 2. Cumulative relative frequency distribution of log2 serum VNTs of the exploratory study (black curve) and the FIH vaccine trial (gray curve). Dotted line marks the 54% of subjects in both studies with a VNT ≤ 9.9 log2.
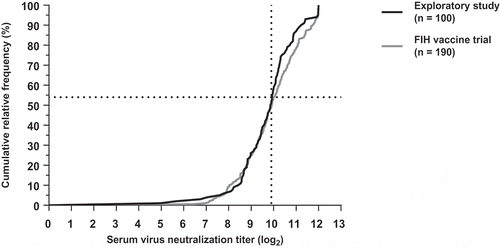
Table 1. Serum virus neutralization titer per month.