
Figures & data
Figure 1. Study population
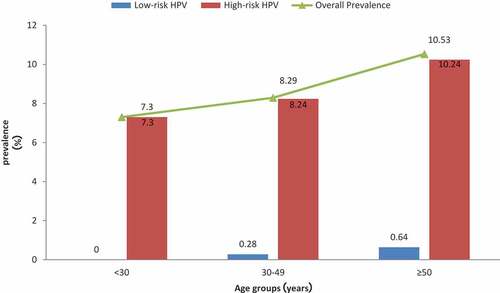
Table 1. Comparison of HPV infection rates among different age groups (%).
Table 2. HPV prevalence and genotype distribution.
Table 3. Distribution of single and multiple HR-HPV infections (n = 888).
Table 4. Univariate analysis of the potential risk factors for HR-HPV infection (n = 10086).
Table 5. Results of multivariate analysis of the potential risk factors for HR-HPV infection (n = 10086).
Supplemental material