
Figures & data
Table 1. Baseline characteristics of participants in the three vaccine lot groups.
Figure 1. Study flow chart. PPS: per-protocol set.
Table 2. Immuno-response at month 7 among the three lot groups (PPS for immunogenicity).
Table 3. Equivalence analysis of GMC at month 7 (PPS for immunogenicity).
Table 4. Immuno-response at month 7 and 42 among three lots groups in participants who were seropositive at baseline*.
Figure 2. Reverse cumulative curves for IgG and neutralizing antibody levels of the three lot groups (per-protocol set) at month 7. Panel A: HPV-16 IgG antibody; Panel B: HPV-18 IgG antibody; Panel C: HPV-16 neutralizing antibody; Panel D: HPV-18 neutralizing antibody.
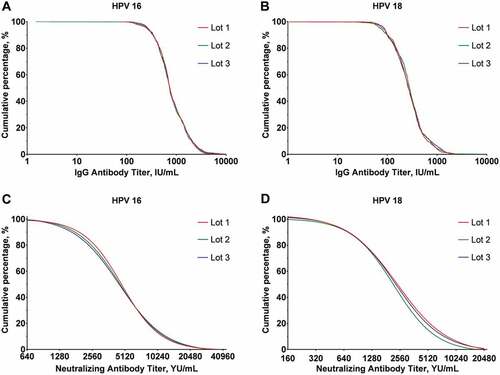
Table 5. Incidence of adverse events (safety analysis).