
Figures & data
Figure 1. The geographical location of Chongqing, China.
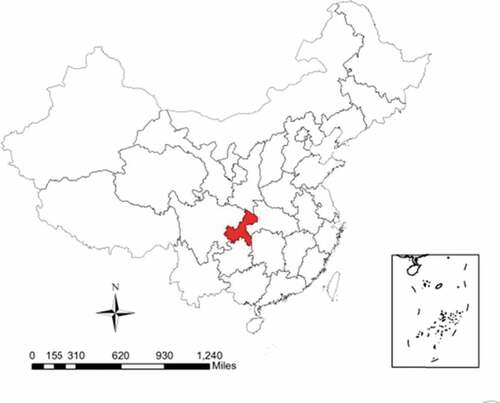
Table 1. Annual number of deaths in Chongqing, China, 2012–2018.
Table 2. Annual sum of total specimens tested and specimens positive for influenza by type/subtypes in Chongqing, 2012–2018.
Figure 2. Weekly number of influenza-associated death per five causes (blue) and the proportion of influenza-positive rate (orange) in Chongqing, 2012–2018.
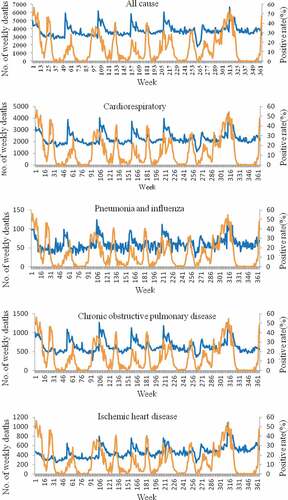
Table 3. Influenza-associated EMRs in 2012–2018 estimated by negative-binomial model.