Figures & data
Figure 1. Perception of the influenza vaccine on a five-point scale; (a) usefulness “for you,” usefulness “for hospitalized patients,” safety, and efficacy of the influenza vaccine; (b) difference between the perceptions of nurses and nurse aides (p < .001 for the differences in the four dimensions) (boxes: 25th percentile, median, and 75th percentile, whiskers: 10th and 90th percentile)
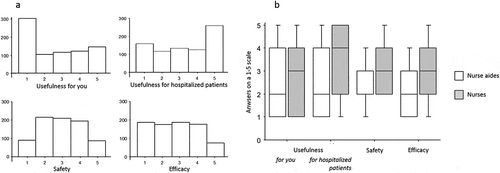
Table 1. Characteristics of participants in the groups with positive and negative behavior toward influenza vaccine
Figure 2. Perceptions of the influenza vaccine according to behavior/intention toward influenza vaccine (p < .001 for the four dimensions) (boxes: 25th percentile, median, and 75th percentile, whiskers: 10th and 90th percentile)
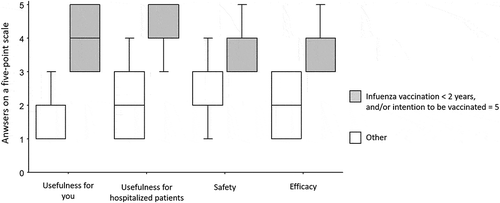
Figure 3. Occupation-related scores
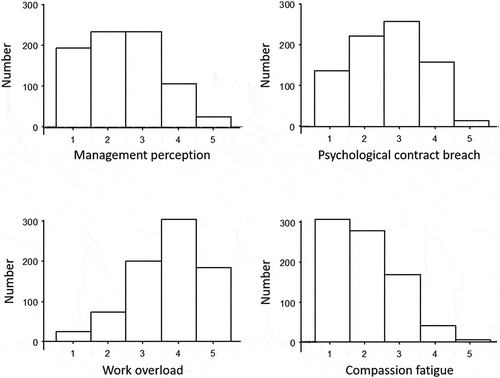
Table 2. Correlation between vaccine perceptions and working condition perceptions
Table 3. Probability of being in the group with positive or negative behavior toward influenza vaccine according to the perceptions of working conditions
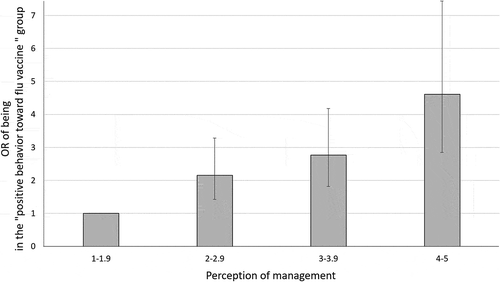
Figure 4. Odds ratio (OR) of being in the “group with positive behavior toward influenza vaccine” according to the perception of management score, with the group with lower scores (1–1.9) being the reference (bars: 95% CI)