Figures & data
Figure 1. Lentiviral vectors and workflow for self-differentiated DC (SD-DC) generation. (a) Schematic representation of lentiviral vectors in this study. (b) Schematic diagram showing the generation of self-differentiated DC (SD-DC) with suppression of TGF-β and IL-10 receptor expression by LV transduction. (c) After transduction for 7 days, cells were harvested and then subjected to immunoblot analysis using antibodies specific to TGF-βRII and IL-10RA
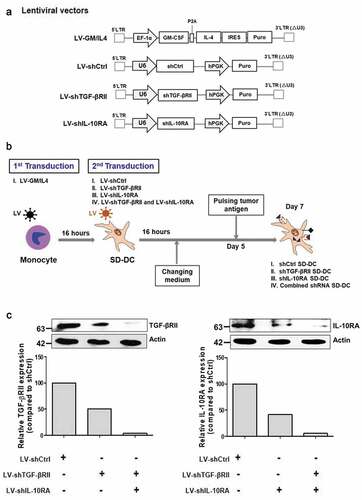
Figure 2. Monocyte-derived self-differentiated DCs (SD-DCs). (a) SD-DCs were transduced with LV-shRNA. After transduction for 5 days, the culture supernatants from the indicated conditions of these SD-DCs were harvested, and the cytokine production of both IL-4 and GM-CSF was determined by ELISA. (b) After transduction for 7 days, the SD-DC morphologies were observed under microscope and compared with DCs generated with conventional method. (c) The percentages of monocytes (CD14+ cells), SD-DCs (CD11c+ cells) with positively expressed HLA-DR, CD40, CD83, and CD86 were examined by flow cytometry. Results represent the mean ± SEM (bars) of three independent experiments
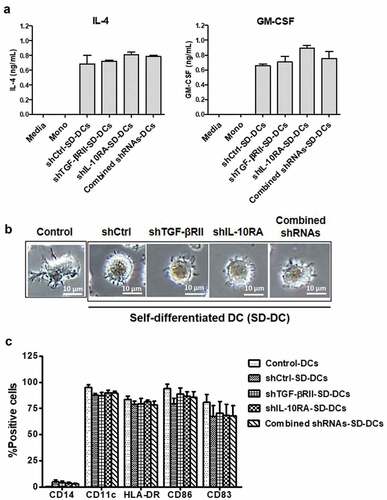
Figure 3. Activation of effector cells by pulsed SD-DCs transduced with shRNAs. Autologous effector cells were co-cultured with pulsed shCtrl-SD-DCs, shTGF-βRII-SD-DCs, shIL-10RA-SD-DCs, and combined shRNAs-SD-DCs for 5 days. (a) Activated effector cells, including CD4 + T-cells, CD8 + T-cells, and NK cells, were stained for cell surface markers and analyzed by flow cytometry. (b) After activation for 7 days, the percentages of IFN-γ-producing T-cells (CD3+ IFN-γ+ cells) were determined by intracellular cytokine staining and then analyzed by flow cytometry. Results represent the mean ± SEM (bars) of three independent experiments. (*p < .05, **p < .01, as analyzed by Student’s t-test)
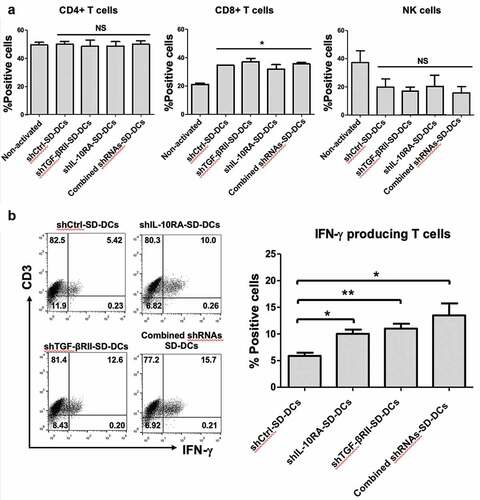
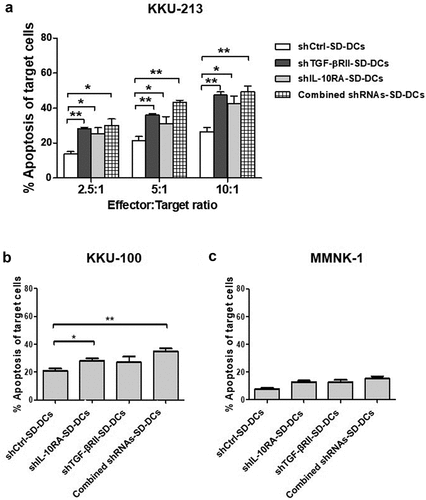
Figure 4. Cytolytic activities of activated effector cells after co-culturing with pulsed SD-DCs transduced with shRNAs to suppress TGF-β and IL-10 receptors against CCA cell lines. (a) Cytotoxicity activities of activated effector T-cells co-cultured with various conditions of pulsed SD-DCs on KKU-213 CCA cell line (at effector to target (E:T) ratios of 2.5:1, 5:1, and 10:1) examined by flow cytometry using AnnexinV-PI staining. (b) Cytolytic activities of activated effector T-cells co-cultured with pulsed SD-DCs against KKU-100 cells (E:T ratio 10:1). (c) Cytolytic activities of activated effector T-cells co-cultured with pulsed SD-DCs against MMNK-1 cells (E:T ratio 10:1). Results represent the mean ± SEM (bars) of three independent experiments. (*p < .05, **p < .01, as analyzed by Student’s t-test)