Figures & data
Figure 1. Characterization of the different truncated versions of HEV pORF2. (a) Schematic representation of different truncated versions of HEV pORF2. The E2s protein (aa 459–606), the shortest version of the dimer form, harbors the major neutralizing epitopes.Citation11 The p213 peptide (aa 394–606) existed in a monomeric form due to Thr residues being mutated to Ala (T564A).Citation11 p239 (aa 368–606) is the vaccine antigen in Hecolin® in a particulate form.Citation13 p495 (aa 112–608), which can form VLPs with icosahedral symmetry, is used in the other HEV vaccine that has been tested in a phase II clinical trial.Citation15 (b) Schematic representation of p239 particle and p213 monomer evolution. p239 and p213 were used for subsequent analysis. The caveat is particulate p239 and monomeric p213 differ in size by 26-aa. (c) The retention times in SEC-HPLC for p239 and p213 were 13.7 min and 18.2 min, respectively. The mutant p213 peptide exists as a monomer with an apparent MW of ~20 kDa. The MW of p239 particles was estimated to be ~3200 kDa.Citation18 (d) Differential scanning calorimetry (DSC) profiles of the p239 particle and p213 monomer. The melting transitions of the p239 particle and p213 monomer were estimated at peak Tm values of 73.79°C and 67.61°C, respectively. (e) SDS-PAGE analysis of p239 particles and p213 monomers. Lanes marked with “N” indicate the sample under non-reducing conditions (in the absence of β-mercaptoethanol and not heated). Lanes marked with “D” indicate the sample under reducing conditions (mixed with β-mercaptoethanol and heated at 100°C for 10 min). (f) The morphologies of the p239 particle and p213 monomer were detected by transmission electron microscopy (TEM). The scale bar was 100 nm.
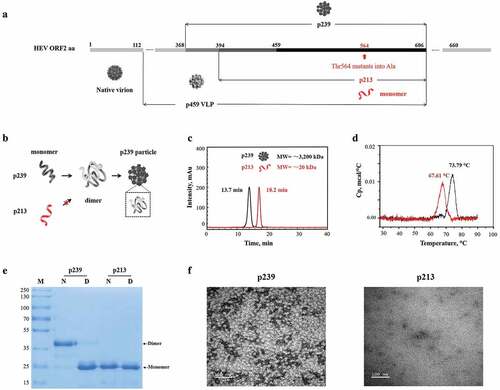
Figure 2. The immunoreactivities of naturally infected patient sera and vaccine-immunized human sera against particles and monomers. The sera showed different immunoreactivities against the particle (black curve) and monomer (red curve) forms. The fold change in the immunoreactivity of sera against particles and monomers was expressed as the ratio of absorbance values at 450 nm (particle/monomer) at a serum dilution of 1:160. (a) Naturally infected patient sera. (b) Vaccine-immunized human sera. (c) Fold changes in the immunoreactivities of naturally infected patient sera and vaccine-immunized human sera at 1:20 and 1:160 dilutions against particles and monomers.
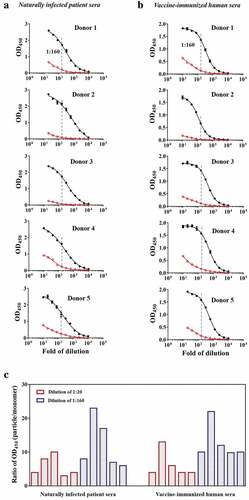
Figure 3. The binding activities of six representative murine mAbs to particles and monomers. (a) mAbs recognizing linear epitopes (3A11, 12A10 and 16D7) to particles (black curve) and monomers (red curve). (b) mAbs recognizing conformational epitopes (8C11, 8G12, and 9F7) to particles (black curve) and monomers (red curve). The neutralizing mAb 8C11 showed more pronounced (>50-fold higher) preferential binding to the particulate over the monomeric antigen than the other two mAbs (8G12 and 9F7) tested in the same comparative study.
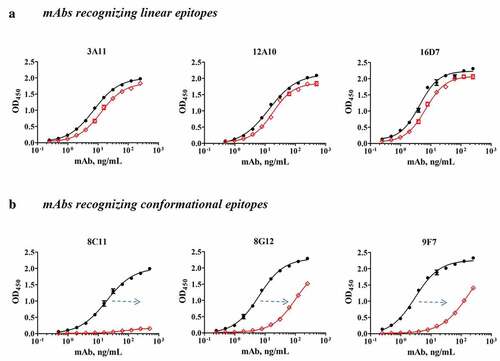
Figure 4. The immunoreactivities of vaccine-immunized mouse sera against particles and monomers. (a) The 32 Balb/C mice were divided into two groups and immunized intramuscularly at three doses at an interval of two weeks (Week 0, 2, 4) with 0.5 µg and 1.0 µg of the p239 protein, respectively. Serum samples were collected once a week (weeks 0–12). (b) The immunoreactivities of sera pooled from multiple mice against particles (black curve) and monomers (red curve). Sera from mice in the same group were mixed at equal volumes. S-a and S-b represent the serum samples from mice at Week 9 administered doses of 0.5 µg and 1.0 µg, respectively; S-c and S-d represent the serum samples from mice at Week 10 administered doses of 0.5 µg and 1.0 µg, respectively. The fold change in the immunoreactivity was expressed as the ratio of absorbance values at 450 nm (particle/monomer) at a mouse serum dilution of 1:160. (c) The fold changes in the reductions of binding activities of vaccine-immunized human sera, mouse sera and murine mAbs to particulate vs. monomeric antigens. The left y-axis depicts the ratio of the endpoint titer (particle/monomer), which represents the fold changes in the reductions of the activities of vaccine-immunized human sera and mouse sera. The ratio of EC50 values (EC50, monomer/EC50, particle) represents the fold change in the reduction of mAb activity. The right y-axis depicts the ratio of absorbance values at 450 nm (particle/monomer) at a serum dilution of 1:160.
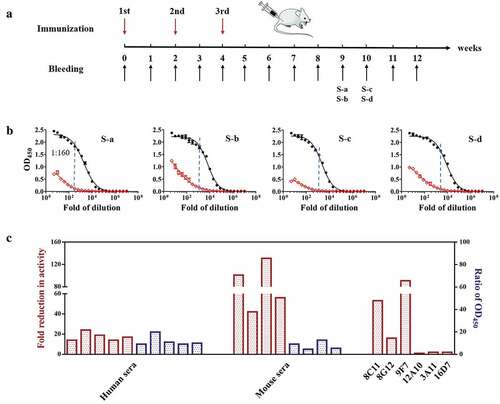
Figure 5. The correlation between binding titers and functional titers. (a) The flow cytometry neutralization assay was used to evaluate the functional titers of vaccine-immunized mouse sera based on fluorescence-labeled p239 for the measurement of cell entry.Citation23 The functional titer was expressed as NT50, which was defined as the dilution required to inhibit 50% of p239 particles from cellular entry. (b) The binding titer was plotted against the corresponding functional titer for the same set of pooled sera. The sera were divided into three grades (high, medium and low levels) based on the binding titers of mouse sera at Week 11; sera at the same level were mixed at equal volumes. All data listed in Table S3 were used for Pearson correlation assay between the binding titers and functional titers. The correlations between binding titers and functional titers were assessed by Pearson correlation analysis. The correlation coefficient was calculated using GraphPad Prism 7.0.
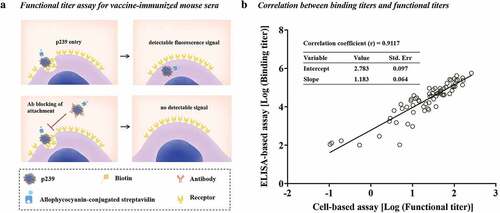
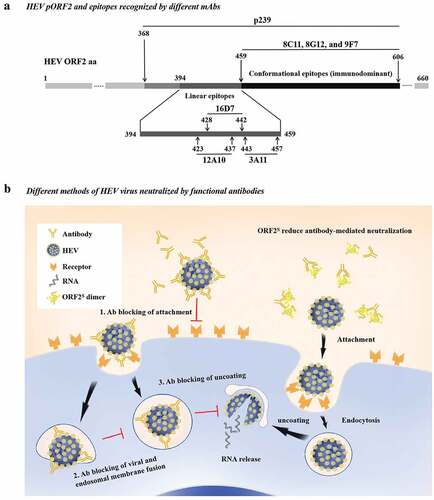
Figure 6. Epitopes of HEV ORF2 recognized by mAbs and the different methods of HEV virus neutralization by functional antibodies. (a) HEV pORF2 and a schematic representation of mAb binding sites localized within the HEV capsid protein. 12A10, 16D7, and 3A11 are the mAbs recognizing the linear epitopes located in aa 423–438, aa 428–442, and aa 443–457, respectively. 8C11, 8G12 and 9F7 are the mAbs recognizing the conformational epitopes located in aa 459–606. (b) The different methods of HEV virus neutralization by functional antibodies.