Figures & data
Table 1. Immunization strategy for the experimental vaccines.
Table 2. Sequences of primers and probes for RT-qPCR.
Figure 1. Rectal temperature of rhesus monkeys after immunization. Two rhesus monkeys in each group were vaccinated intramuscularly with either CV-A16 alone, EV-A71 alone, or a combination of both at an equal dose of 7 Log CCID50, and rectal temperature was measured daily over the period of twelve days post-immunization. The rectal temperature of the monkeys received CV-A16 alone are represented in (a) and (b); the rectal temperature of the monkeys EV-A71 alone are shown in (c) and (d); the rectal temperatures of the monkeys a live combination of EV-A71 and CV-A16 are shown in (e) and (f). The light gray lines indicate the baseline temperature of each monkey before immunization and the dark gray dotted lines indicate the daily rectal temperature of each monkey over 12 days post-immunization.
Figure 2. Representative histopathological changes in tissue sections as seen with H&E staining (magnification: 200X). Rhesus monkeys were treated intramuscularly with either CV-A16 alone, EV-A71 alone, or both EV-A71 and CV-A16 at an equal dose of 7 Log CCID50. In each group, one animal was euthanatized, and the brain, spinal cord, visceral organs, and skeletal muscle and lymph nodes were resected for histopathological examination. A few lymphocytic cuffs were observed in the midbrain (a) and pons (b) of the animal treated with CV-A16 alone. Glial nodules representing the aggregates of lymphatic cells in the lumbar (d) and cervical (e) regions were observed in the spinal cord of the animal treated with CV-A16 alone. The enlargement of lymphoid follicles on the alveolar walls of the animal treated with CV-A16 alone is shown in (g). The animal injected with EV-A71 alone presented thickened alveolar walls along with the areas of congestion and edema as shown in (h) Moderate lymphocytic aggregations in portal areas of the liver in the animal treated with CV-A16 alone are shown in (j). A small number of infiltrated inflammatory cells were observed in the liver parenchyma of the animal treated injected with EV-A71 (i). However, no significant pathological changes were observed in the brain (c), spinal cord (f), lung (i), and liver (l).
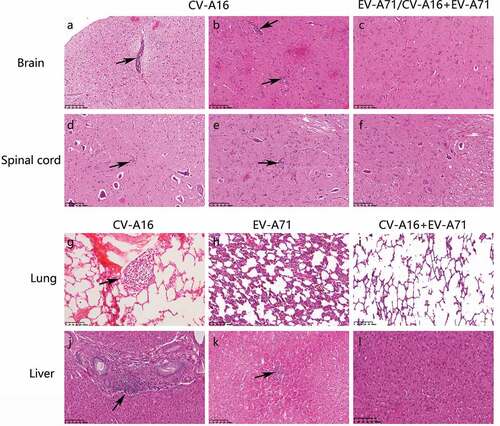
Figure 3. Viral load in plasma and feces. Plasma and feces were collected at the indicated time points to detect the viral RNA load after immunization with EV-A71 alone, CV-A16 alone, or the combined live vaccine. The viral shedding of CV-A16 in plasma over 27 days (a) and in feces over 14 days (b) are shown following the CV-A16 alone and combination vaccination, respectively. (c) and (d) indicate the viral shedding of EV-A71 in plasma and feces during the same period in the animals immunized with EV-A71 alone and the combination vaccine, respectively.
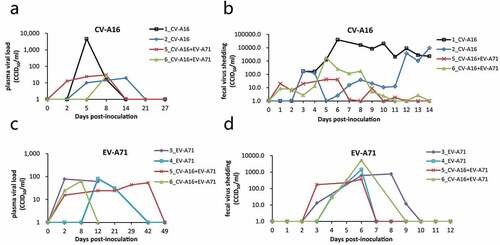
Figure 4. Measurement of biochemical markers in monkeys inoculated injected with EV-A71 alone, CV-A16 alone, or the combined vaccine. The serum levels of AST (a), γ-GT (b), ALT (c), UA (d), ALP (e), urea (f), and CREA (g) were measured by using an automatic analyzer. The black dotted line represents the normal ranges of these indices. The blue, red and green histograms represent the animals injected with CV-A16 alone, combination vaccine, and the EV-A71 alone, respectively.
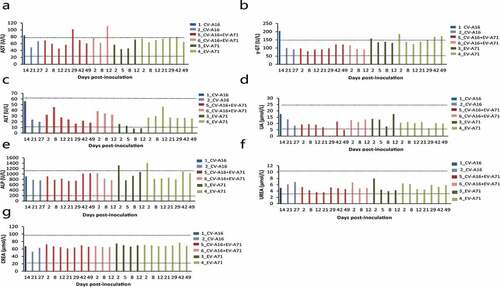
Figure 5. Specific antibody responses against CV-A16 or EV-A71 induced by the experimental vaccines. A ratio of 1:8 was considered as the detection, but not the protective threshold. Data represents the geometric mean of the antibody titer from three independent experiments.
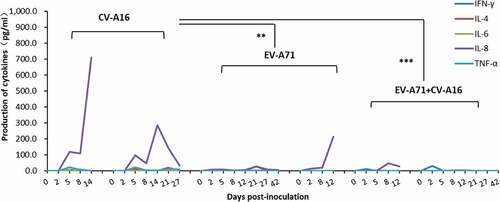
Figure 6. Expression levels of the five cytokines and chemokines in the plasma of monkeys immunized with EV-A71 alone, CV-A16 alone, or the combined vaccine. *p< .05, **p< .01, *** P < .001.