
Figures & data
Table 1. Examples of tweets included in the training set
Figure 1. Word cloud representation of tweets in the training dataset by class (A. in favor, B. against)
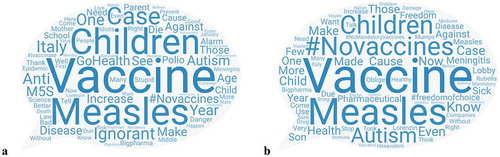
Figure 2. Number of tweets per month, total and by class (in favor, against, neutral), September 2016 – August 2017
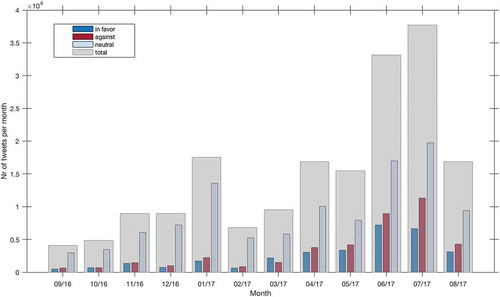
Figure 3. Proportion of tweets by category (in favor, against, neutral) by month, September 2016 – August 2017
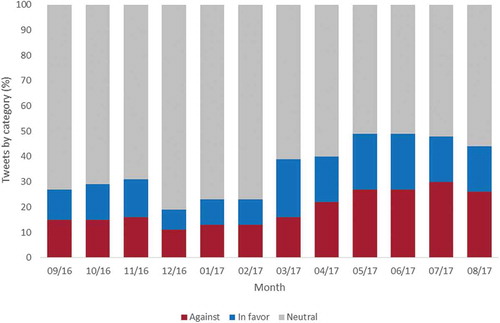
Figure 4. Analysis of neutrality and negative rates on vaccine-related events
Panel a. Publication of the National Plan for the Vaccine Prevention (PNPV) 2017–19 and agreement with Italian Regions for a vaccination-enforcing law (January 26th, 2017); Panel b. Approval of the Legislative Decree n. 73 introducing 12 compulsory vaccinations (June 7th, 2017); Panel c. Approval in the Italian Chamber of Deputies of the Vaccines Decree (July 28th, 2017); Panel d. Approval of the law establishing vaccination requirements for school children in Emilia Romagna Region (November 22nd, 2016); Panel e. News about the increase of 230% cases of measles in Italy (March 16th, 2017). A two-sample test for equality of proportions, with Bonferroni correction for multiple comparisons, was performed. Adjusted p-value significance is shown (• <0.10, * <0.05, ** <0.01, *** <0.001). Comparisons are made with baseline (days −5 to −1). Error bars show 95% binomial confidence intervals for proportions.
Table 2. Accuracy of the monitoring tool for single events