1,002
Views
2
CrossRef citations to date
0
Altmetric
Research Paper

Immunogenicity and safety after the third vaccination with the 23-valent pneumococcal polysaccharide vaccine in elderly patients with chronic lung disease

ORCID Icon, , &
Pages 2285-2291 | Received 04 Nov 2019, Accepted 16 Jan 2020, Published online: 12 Feb 2020

Figures & data

Table 1. Baseline characteristics of 16 patients with chronic pulmonary diseases.

Table 2. Comparison of geometric mean concentrations (GMCs) and geometric increases (n-fold) in levels of serotype-specific IgG and the opsonization index (OI) for serum samples from the 16 participants before and after the first, second, and third vaccinations.

Figure 1. The GMCs of serotype-specific IgG required for 50% killing of bacteria for serotypes 6B (diamonds), 14 (squares), 19F (triangles), and 23F (circles) before and after the first, second, and third vaccinations with 23-valent pneumococcal polysaccharide vaccine. **P < .01 and *P < .05 versus before the first vaccination.

Figure 1. The GMCs of serotype-specific IgG required for 50% killing of bacteria for serotypes 6B (diamonds), 14 (squares), 19F (triangles), and 23F (circles) before and after the first, second, and third vaccinations with 23-valent pneumococcal polysaccharide vaccine. **P < .01 and *P < .05 versus before the first vaccination.

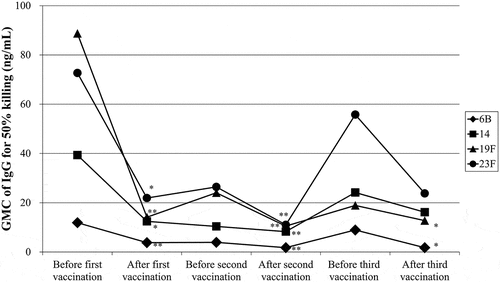
Table 3. Percentages of participants with local and systemic reactions by day after the third vaccination.

Figure 2. Comparison of adverse reactions between the first, second, and third vaccinations in the study participants. Local adverse reactions (A) and systemic symptoms (B) were compared between the first, second, and third vaccinations. Data are shown as the frequencies of participants who received the first, second, and third vaccinations (n = 16). The grade of the finding or symptom is expressed as none (open bar), mild (slash bars), moderate (gray bars), or severe (closed bars). **P < .01 and *P < .05 versus the primary vaccination.

Figure 2. Comparison of adverse reactions between the first, second, and third vaccinations in the study participants. Local adverse reactions (A) and systemic symptoms (B) were compared between the first, second, and third vaccinations. Data are shown as the frequencies of participants who received the first, second, and third vaccinations (n = 16). The grade of the finding or symptom is expressed as none (open bar), mild (slash bars), moderate (gray bars), or severe (closed bars). **P < .01 and *P < .05 versus the primary vaccination.

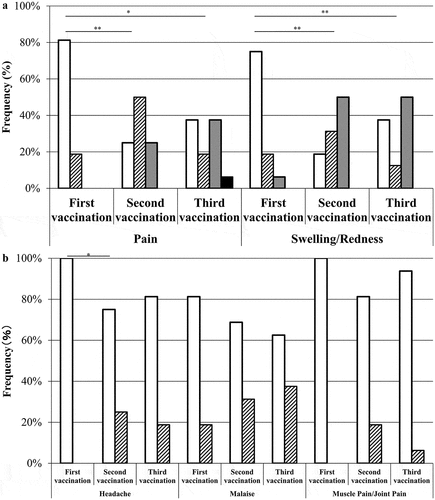
Table 4. Relationship between geometric mean concentrations (GMCs) before the third vaccination and local adverse reactions after the third vaccination in the 16 participant.

Reprints and Corporate Permissions

Please note: Selecting permissions does not provide access to the full text of the article, please see our help page How do I view content?

To request a reprint or corporate permissions for this article, please click on the relevant link below:

Academic Permissions

Please note: Selecting permissions does not provide access to the full text of the article, please see our help page How do I view content?

Obtain permissions instantly via Rightslink by clicking on the button below:

If you are unable to obtain permissions via Rightslink, please complete and submit this Permissions form. For more information, please visit our Permissions help page.