Figures & data
Figure 1. A graphical representation of the two-state Markov model of seasonal influenza vaccination uptake and of the four kind of transitions
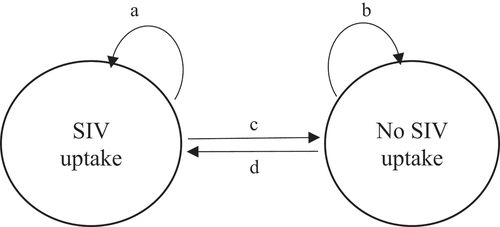
Table 1. Study cohort characteristics during the first and last season n/n + 1 of follow-up (EGB, France, 2006/07–2015/16, n = 16,026)
Figure 2. Proportion of the study population according to the number of SIV uptake transitions over the 10-year follow-up period (EGB, France, 2006/07–2015/16, n = 16,026)
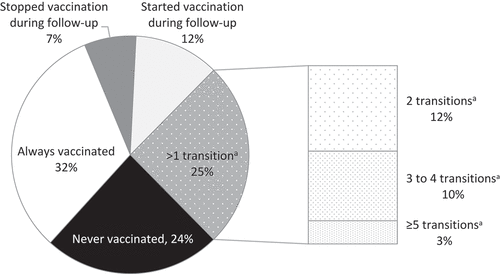
Table 2. Demographic and clinical characteristics associated with each SIV uptake transition – Hazard ratios and 95% confidence intervals – Two-state Markov model estimates (EGB, France, 2006/07–2015/16, n = 16,026)
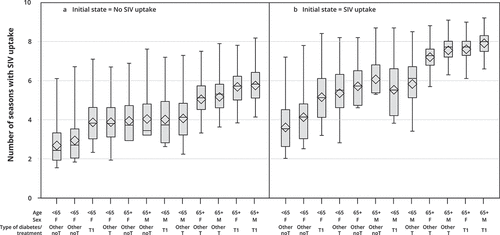
Figure 3. Box-plot diagrams1 for the expected number of seasons with SIV uptake over 10 SIV seasons according to demographic-clinical profiles2 among patients with no SIV uptake at the beginning of the period (Figure 3a) and among patients with SIV uptake at the beginning of the period (Figure 3b) – Two-state Markov model estimates3 (EGB, France, 2006/07–2015/16, n = 16,026).
Abbreviations: F, female; Other noT, other types of diabetes without any treatment; Other T, other type of diabetes treated by insulin and/or antidiabetic drugs; M, men; SIV, seasonal influenza vaccination; T1, type 1 diabetes.
1 The box extends from the 25th percentile to the 75th percentile. The line in the middle is the median (i.e., the 50th percentile). The diamond inside the box is the mean. The whiskers, those two lines at either end, extend from the box as far as the minimum and maximum values, up to 1.5 times the interquartile range (i.e., the distance from the 25th percentile to the 50th).
2 Profiles are ranked in ascending order of the expected (i.e., predicted by the MSM model) number of seasons with SIV uptake for patients not vaccinated at the beginning of the period.
3 For each profile, all remaining covariates (individual chronic condition score, hospital stays for diabetes/influenza, healthcare use) are set to their mean values.
Reading Figure 3a: for a woman not vaccinated at the beginning of the period and younger than 65 years with untreated diabetes, the expected number of seasons with SIV uptake over the next 10 SIV seasons was estimated at 2.6.
Reading Figure 3b: for a woman vaccinated at the beginning of the period and younger than 65 years with untreated diabetes, the expected number of seasons with SIV uptake over the next 10 SIV seasons was estimated at 3.6