
Figures & data
Table 1. Demographic characteristics of samples included from 2016 through 2018 (N = 6216)
Figure 1. Results of rubella IgG testing by age in years for records with known age (n=6021)
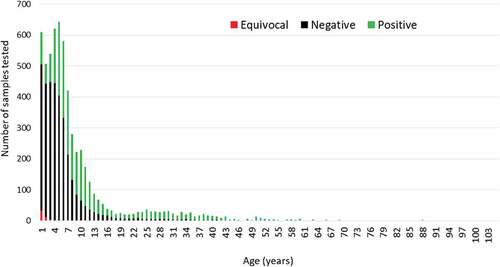
Figure 2. Proportion of rubella susceptible (IgG negative) individuals among males and females. Error bars represent 99% confidence intervals
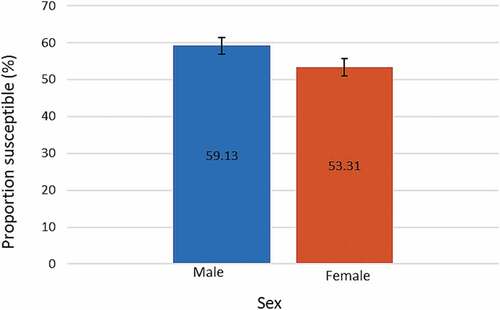
Figure 3. Proportion of rubella susceptible (IgG negative) individuals in each age group among males and females
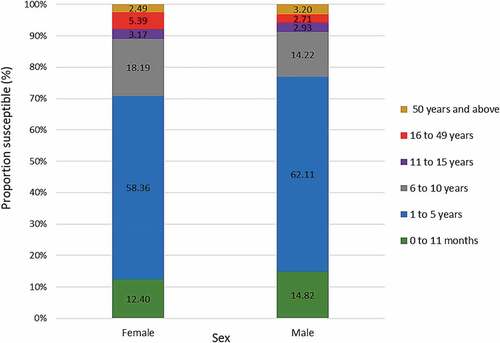
Figure 4. Proportion of rubella susceptible (IgG negative) individuals for each province. Error bars represent 99% confidence intervals
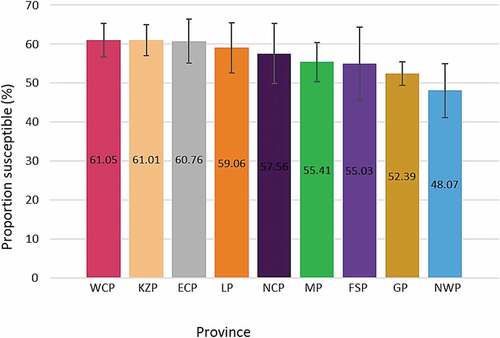
Figure 5. Proportion of rubella susceptible (IgG negative) individuals by age group. Error bars represent 99% confidence intervals
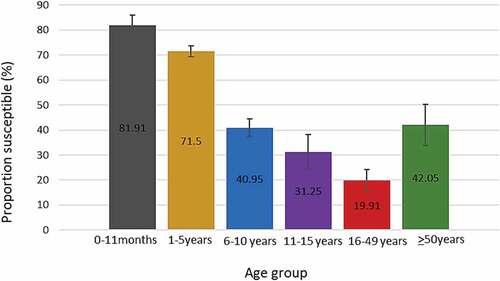
Table 2. Unadjusted and adjusted logistic regression analyses