Figures & data
Figure 1. Binding activity of M0313 to SEB. (a) Combination of M0313 with linear epitope of SEB and mSEB detected by western blotting. (b) Binding activities of M0313 determined by ELISA. The absorbance of different concentrations of M0313 (0.000125 to 0.25 μg/mL) at 450 nm was shown. Kinetic analysis of the binding of M0313 to mSEB (c) and SEB (d) measured by BLI with a 300-s association step followed by a 300-s dissociation step. The Numbers 1 to 5 represent 50, 25, 12.5, 6.25, and 3.12 nM SEB were analyzed for binding to immobilized M0313, respectively.
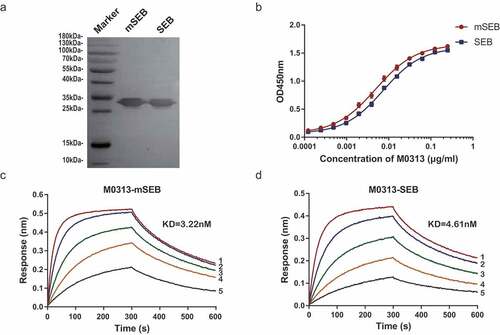
Figure 2. Inhibition of cell proliferation and cytokine release. (a) Inhibition of SEB-induced mouse splenic lymphocyte proliferation. Mouse splenic lymphocytes (5 × 10⁵ cells) in the mAb group were incubated with 1 nM SEB and two continuous diluents of M0313 at concentrations ranging from 0.156 to 40 nM. (b) Inhibition of SEB-induced IL-2, IL-6, IFN- γ, and TNF-α release in the supernatant of mouse splenic lymphocytes. Mouse splenic lymphocytes (5 × 10⁵ cells) in the mAb group were incubated with 2 nM SEB and two continuous diluents of M0313 at concentrations ranging from 1.56 to 200 nM. (c) Inhibition of SEB-induced human PBMC proliferation. Human PBMCs (1 × 10⁵ cells) in the mAb group were incubated with 2 nM SEB and two continuous diluents of M0313 at concentrations ranging from 1.56 to 200 nM. (d) Inhibition of SEB-induced IL-2, IL-6, IFN-γ, and TNF-α release in the supernatant of human PBMCs. Human PBMCs (6 × 10⁵ cells) in the mAb group were incubated with 2 nM SEB and two continuous diluents of M0313 at concentrations ranging from 1.56 to 200 nM.
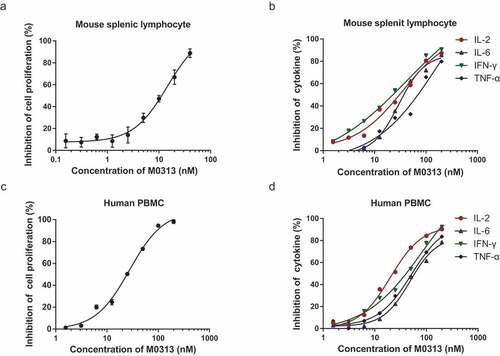
Figure 3. Toxin neutralization in vivo. (a) Survival of mice in the M0313 and NS groups 7 d after the challenge (n = 10). (b) Concentrations of serum cytokines in both the groups 5 h after the challenge (n = 5). The histogram represents the concentrations of IL-2, IL-6, IFN-γ, and MCP-1. (c) Microscopic examination of the pathological sections of the lung and spleen tissues that were fixed 5 h after the challenge. Images were captured at 100 × and 400 × magnification. (d) Pathological score of the mouse lung. (e) Pathological score of the mouse spleen. “*” indicates P < .05.
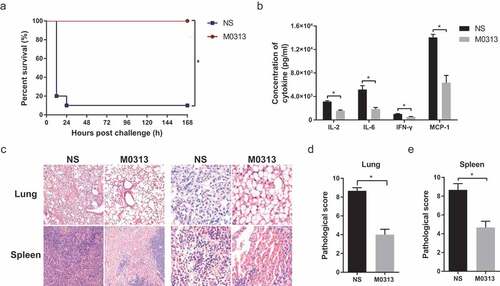
Figure 4. Protection against S. aureus-induced sepsis. (a) Survival of mice administrated M0313 24 h before MRSA252 challenge (n = 10). (b) Survival of mice administrated M0313 1 h after MRSA252 challenge (n = 10). (c) Survival of mice administrated M0313 24 h before SEB-expressing JN064 challenge (n = 10). (d) Survival of mice administrated M0313 24 h before non-SEB-expressing JN028 challenge (n = 10). The abscissa represents the number of hours after the challenge, and the ordinate represents the per-day survival rate. “*” indicates significant difference (P < .05).
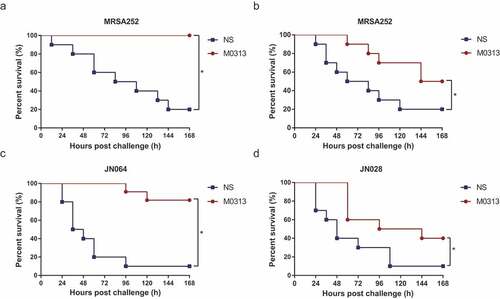
Figure 5. Live imaging of mice after intraperitoneal injection of Xen29. (a) In vivo bioluminescence images of untreated, NS, and M0313-treated mice (n = 2, 10, 10, respectively). Three groups of mice were monitored using the in vivo imaging system on Days 1, 3, and 5 after the challenge. (b) Quantitative analysis results of the bioluminescence signals. The histogram represents the average bioluminescence radiance. “*” indicates significant difference (P < .05) while “n.s.” indicates no significant difference (P ≥ 0.05).
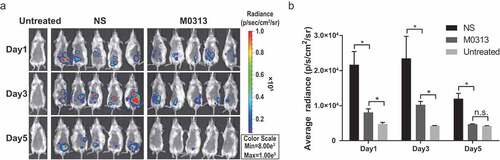
Figure 6. Inhibition of SEB binding to MHC II and TCR. (a) Inhibition of SEB binding to MHC II. Raji cells were incubated with 20 µg SEB and two continuous diluents of M0313 at amounts ranging from 6.25 to 200 µg. (b) Inhibition of SEB binding to TCR. Mouse splenic lymphocytes (5 × 10⁵ cells) were incubated with 30 µg SEB and two continuous diluents of M0313 at amounts ranging from 9.38 to 300 µg.
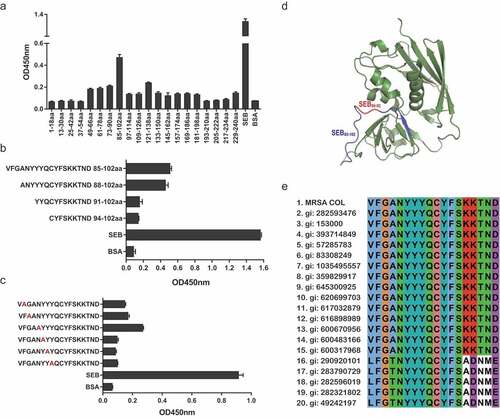
Figure 7. Epitope mapping results of M0313 with SEB measured by ELISA. (a) Binding of M0313 to 20 overlapping peptides that spanned the entire length of SEB. (b) Binding of M0313 to three truncated peptides of SEB85-102. The ordinate represents the amino acid sequence and position of the polypeptides. (c) Binding condition of M0313 to six mutant peptides of SEB85-102. Red indicates the mutated amino acid. (d) The position of immunodominant peptides SEB85-102 (blue) and key amino acids SEB90-92 (red) in the three-dimensional structure of SEB. (e) Sequence alignment of SEB85-102 in SEB selected from MRSA COL and other 19 S. aureus strains.