Figures & data
Table 1. Summary of study characteristics
Figure 1. The risk of bias summary for each included study
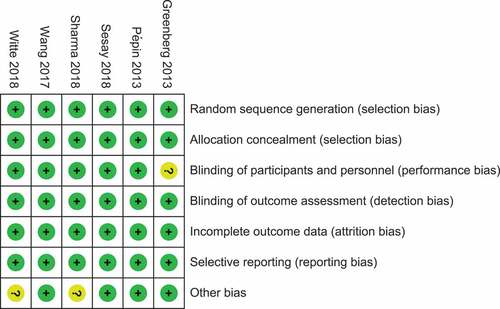
Figure 2. (a) The seroprotection rate (SPR) of older vs. younger adults for the four virus strains after vaccination (SPR was defined as the percentage of participants with a HAI titer of ≥40). (b) The seroconversion rate (SCR) of older vs. younger adults for the four strains after vaccination (SCR was defined as the percentage of those with either a pre-vaccination HAI titer of <10 and a post-vaccination HAI titer of ≥40, or a pre-vaccination HAI titer of ≥10 and a ≥ fourfold increase in HAI titer after vaccination)
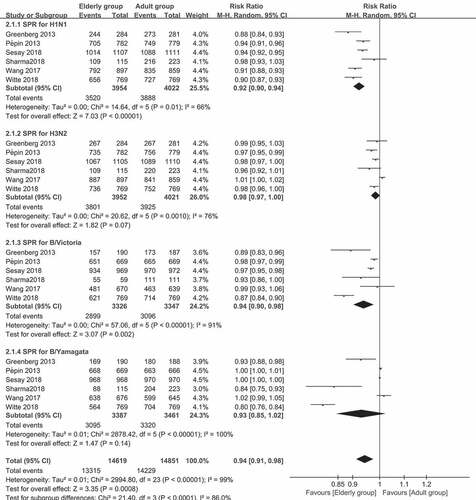
Figure 2. (Continued)
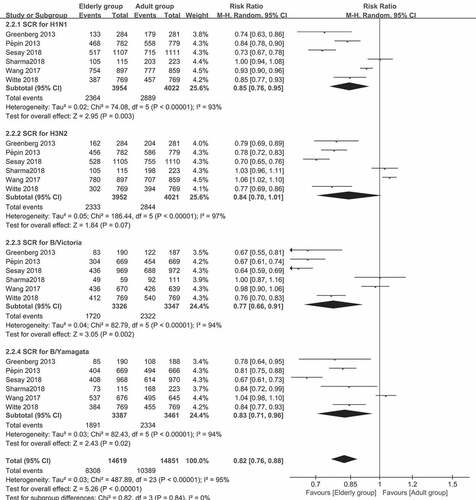
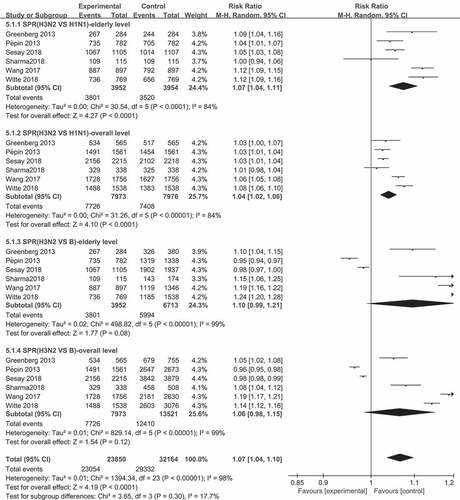
Figure 3. Comparison of seroprotection rates (SPRs) across virus types and subtypes after influenza vaccine vaccination (SPR was defined as the percentage of participants with a HAI titer of ≥4