
Figures & data
Table 1. The site of infection according to the years
Table 2. Serotype distribution of Streptococcus pneumoniae according to clinical samples and vaccination status
Figure 1. Vaccine serotype coverage rates for PCV7, PCV10 and PCV13 before and after the inclusion of PCV7 and PCV13 in Turkey’s NIP according to the years
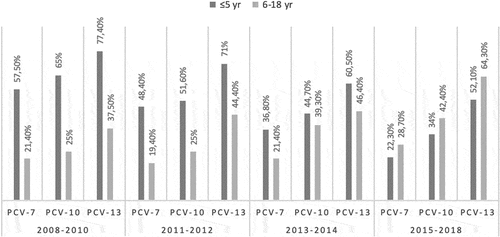
Table 3. Penicillin-resistance rate of serotypes