Figures & data
Figure 1. Circulating CCR7-expressing CD8 and CD4 T cells transiently decrease after primary YF-17D vaccination
Figure 2. CCR7 and CD69 co-expression correlates with the reduction of T lymphocytes in the blood. A. Linear correlations between the CD8 T cell drop and the percentage of CD8 T cells expressing CD69 at baseline (n = 10) and between the CD4 T cell drop and the percentage of CD4 T cells expressing CD69 at baseline (n = 10). B Linear correlations between the CD8 T cell drop and the percentage of CD8 T cells expressing CD69 at day 7 after YF-17D primary vaccination (n = 10) and between the CD4 T cell drop and the percentage of CD4 T cells expressing CD69 at day 7 after YF-17D primary vaccination (n = 10). The Spearman r value and the p-value are indicated on each graph
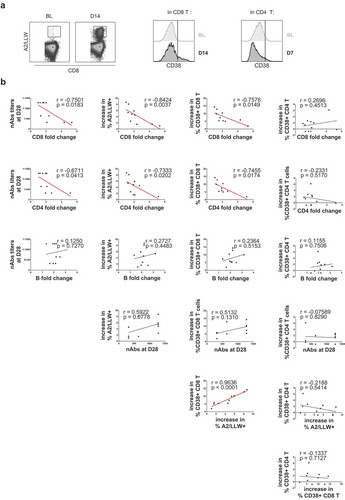
Figure 3. Inter-relation between T and B lymphocyte drops, T cell responses and neutralizing antibodies after primary YF-17D vaccination