Figures & data
Figure 1. Schematic of the two clinical trials and immunologic parameters tested relative to receipt of the vaccines
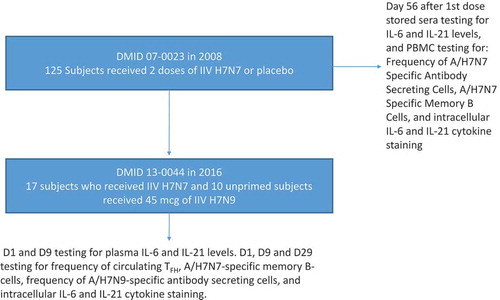
Figure 2. Correlation of Day 9 plasma IL-6 and IL-21 concentrations with HAI and MN antibody titers
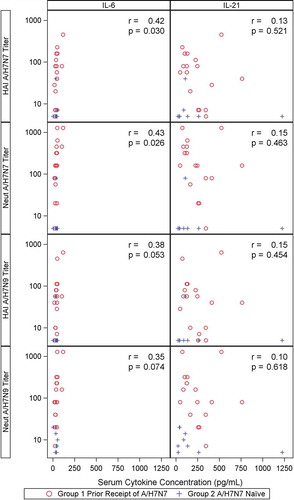
Figure 3. Percent of T-cells expressing IL-21 (Panel A) and percent of T-cells expressing IL-6 (Panel B) on Day 9 and Day 29 by seroconversion of H7N9 HAI and MN antibodies
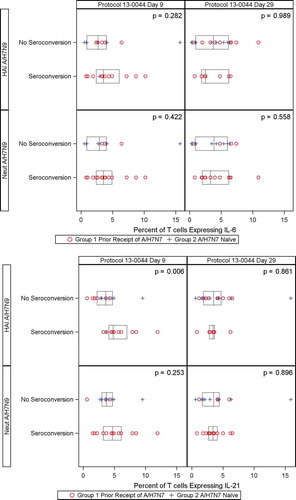
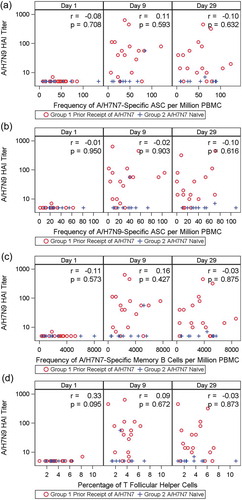
Figure 4. Correlation between the frequency of H7N7-specific MBCs (as number of spot-forming antigen-specific memory B cells million PBMCs, Panel A), H7N7-specific ASCs (number of spot-forming H7N7-specific ASCs per million PBMCs, Panel B), H7N9-specific ASCs (number of spot-forming H7N9-specific ASCs per million PBMCs, Panel C) and circulating TFH cells (Panel D) and H7N9 HAI titers on Day 9 and Day 29