Figures & data
Table 1. Clinical characteristics of HIV+ individuals.
Figure 1. Plasma levels of antigen-specific neutralizing antibody titers. The median titer of neutralizing antibodies (Nab) against H1N1(A), H3N2(B), and B viruses in HIV+ individuals before (D0) and after (D28) vaccination(C).
Figure 2. Cellular immune responses to vaccination are related to influenza Nab production in HIV+ individuals. (A) Dot plots from a representative donor show subsets of CD4+T cells, B subset (naïve, memory), Annexin V and Ki67 staining. (B) Frequencies of AnnexinV+ total CD4+T cells and before (D0) and after (D7) vaccination. (C) Frequencies of AnnexinV+ total B cells and subsets of B cells before (D0) and after (D7) vaccination. (D) Intracellular Ki-67 expression in total CD4+T cells and subsets of CD4+T cells before (D0) and after (D7) vaccination. (E) Intracellular Ki-67 expression in total B cells and subsets of B cells before (D0) and after (D7) vaccination. (F) Correlation analysis between cellular immune response on day 7 (D7) and Nab production on day 28 or Nab fold change (D28/D0) in HIV-infected subjects. (G) Correlation analysis between AnnexinV expression in CD4+T cells or B cells on D7 and the fold change (D28/D0) of Nab against influenza H1N1 subtype in HIV+ subjects. (H) Correlation analysis between Ki-67 expression in CD4+T cells or B cells on D7 and the Nab against influenza H1N1 subtype on D28 in HIV+ subjects. Wilcoxon matched-pairs signed rank t-test and Spearman’s correlation test.
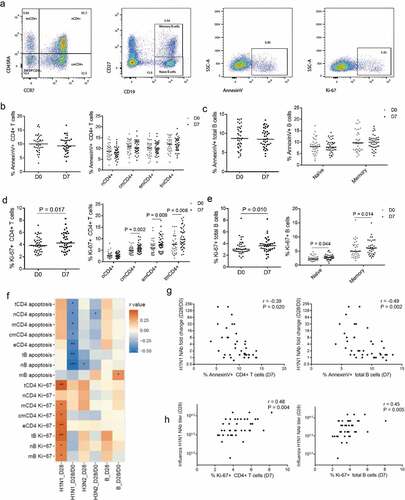
Table 2. The identified gene expression pathways from Kyoto Encyclopedia of Genes and Genomes (KEGG).
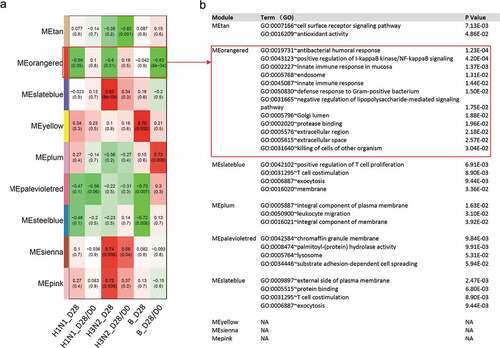
Figure 3. Gene co-expression modules in blood transcriptional profiles related to Nab production. (A) Gene set enrichment analysis of gene modules identified with WGCNA. Several significant module-trait associations are shown. (B) Gene ontolog gene function clustering analysis of each significant module.