
Figures & data
Figure 1. SmartVax ZVL vaccination data. (a) Monthly number of ZVL vaccinations from April 2015 to September 2019. Before commencement of the National Shingles Vaccination Program, between April 2015 and September 2016, between one and 18 doses were recorded per month, which are not discernible in the figure. (b) Number of ZVL vaccinations by age from April 2015 to September 2019
Figure 2. Rates of PBS antiviral prescriptions for herpes zoster over time in the 60–69 years, 70–79 years, and ≥80 years age groups (per million population). (a) Age-specific rates of PBS antiviral prescriptions for herpes zoster are presented as moving annual totals per million population. (b) Age-specific trends in rates of PBS antiviral prescriptions for herpes zoster over time before the introduction of the National Shingles Vaccination Program were analyzed using log-linear regression. Estimated rates per million population are presented in bold dash-dot lines (− ∙ −), with 95% prediction intervals in dashed-triple dot lines (− ∙∙∙ −). Observed quarterly rates of PBS antiviral prescriptions for herpes zoster per million population are presented as individual data points (●). Vertical dashed line indicates the start of the National Shingles Vaccination Program
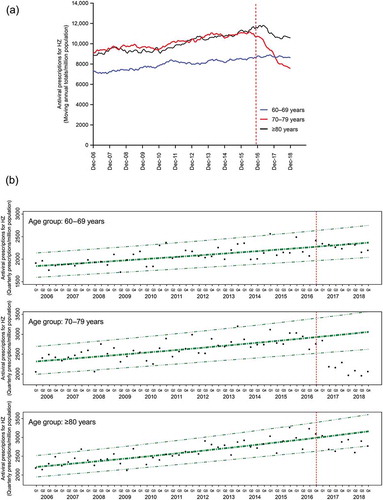
Table 1. Estimated trends in age-specific antiviral prescriptions for herpes zoster
Table 2. Factors influencing the uptake of the herpes zoster vaccine.a