Figures & data
Figure 1. Representativeness of the GPs panel using Crossway® software and the full web MLM (monLogicielMedical.com) solution, compared to the metropolitan GPs population
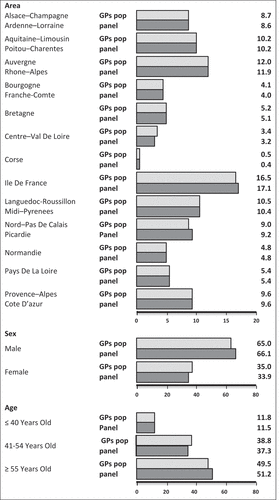
Figure 2. Population panel representativeness as regards sex ratio and population pyramid compared to the global population (from the National Institute for Statistics and Economic Studies)
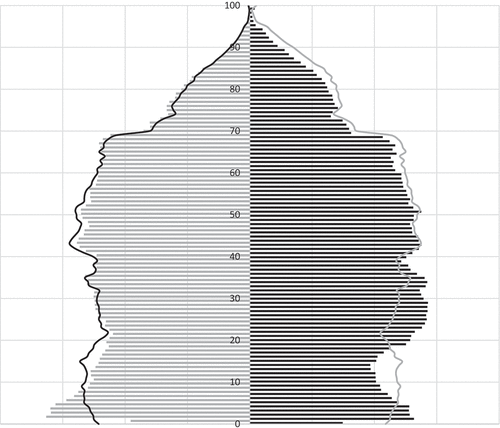
Figure 3. Flowchart: selection of patients
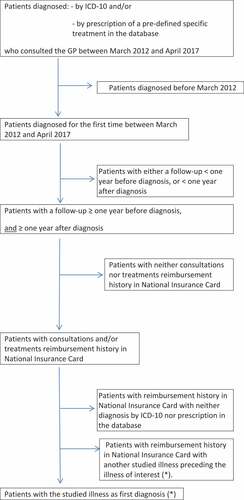
Table 1. Demographic characteristics of patients in the study and control groups
Table 2. Number of patients according to the period and the diagnosis
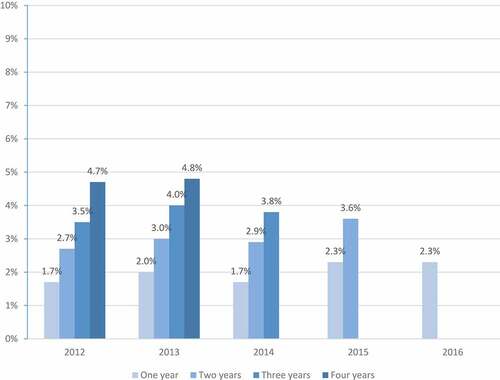
Figure 4. Pneumococcal vaccination coverage (PVC) according to the time of follow-up after diagnosis in the studied populations: patients diagnosed from 2013 to 2016 (study period) and patients diagnosed in 2012 (control period)