Figures & data
Table 1. Sequence of primers and amplified fragments
Figure 1. Preparation of cellular vaccines. (A) bEnd.3 morphology of microvascular endothelial cells in rat brains (10×). (B) Immunohistochemical examination of bEnd.3 expression of vWF and CD31 in cells. (C) HUVEC morphology (10 ×). (D) Immunohistochemical detection of vWF and CD31 expression in HUVECs. (E–G) RT-PCR detection of VEGFR-II and integrin αν gene expression in bEnd.3 cells, HUVECs and LLCs
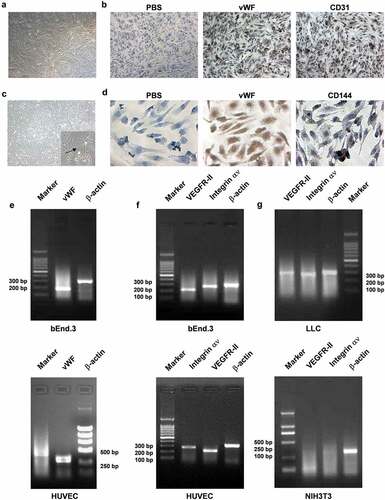
Table 2. Changes of tumor volume in subcutaneous Lewis lung cancer transplantation in the vaccine prevention group (mm3) [n = 8, ()]
Figure 2. The bEnd.3 vaccine inhibited the growth of subcutaneous grafts of lung cancer in mice and prolonged the survival of mice. (A) Survival curve of mice in the prevention group..The mice in the bEnd.3 group showed significantly longer survival times than those in the NIH3T3 and PBS groups (*p < .05) (B) Tumor tissue samples and HE staining in the prevention group. (C) Tumor volume changes in the T cell treatment group.The mice in the bEnd.3 group showed smaller than those in the NIH3T3 and PBS groups (*p < .05) (D) Survival curve of T cell-treated mice.The mice in the bEnd.3 group showed significantly longer survival times than those in the NIH3T3 and PBS groups (*p < .05) (E) H&E staining of tumor tissues in the cell therapy group. (F) Changes in tumor volume in the serum treatment group. (G) Survival curve of mice in the serum treatment group. Serum therapy achieved results similar to T cell therapy but was less effective than in the T cell group, mainly due to the relatively short survival period and the absence of significant tumor tissue necrosis (p > .05) (H) H&E staining of tumor tissues in the serum treatment group. 1, bEnd.3 group; 2, HUVEC group; 3, NIH3T3 group; 4, PBS group
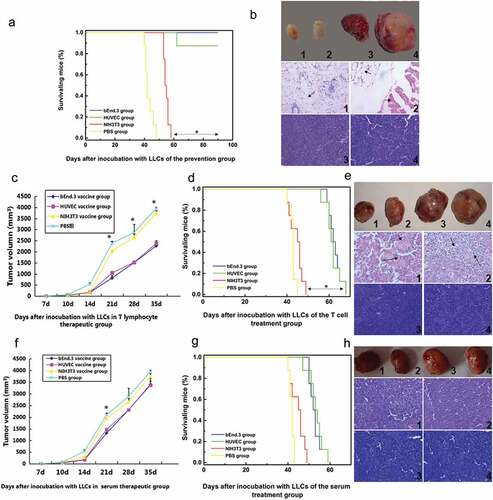
Table 3. Comparison of CTL killing activity of spleen T lymphocytes in immunized mice against different target cells in vitro [n = 4, () %]
Table 4. Inhibitory effect of antiserum from different immunized mice on proliferation of different target cells [n = 4, ()]
Figure 3. Specific CTL cytotoxicity induced by the same bEnd.3. (A and B) Expression of CD3 and CD8 on the surface of T lymphocytes in the spleen of immunized mice. (C) ELISA was performed to detect antibody titer in immunized mice. (D) ELISA was used to detect the specific immune response to antiserum in immunized mice
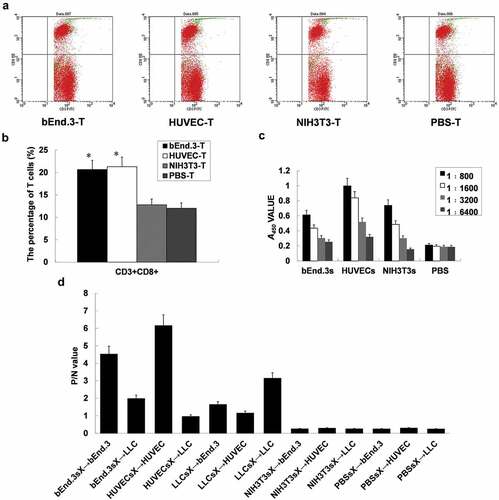
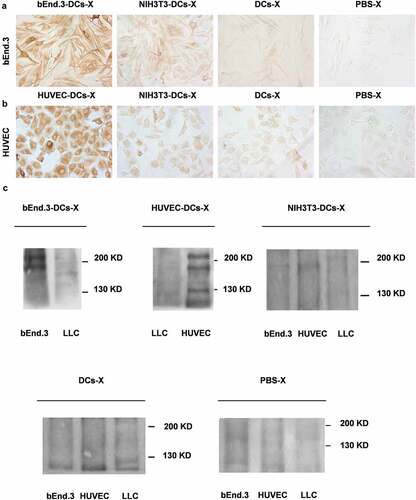
Figure 4. bEnd.3 antibody production induced by the vaccine in immunized mice. (A and B) Immunohistochemical staining was used to detect the specific anti-serum reaction of immunized mice. (C) Immunoblotting was performed to assess the anti-VEGFR-II and integrin αν antibodies in the immune serum of mice. (D) Wound healing response
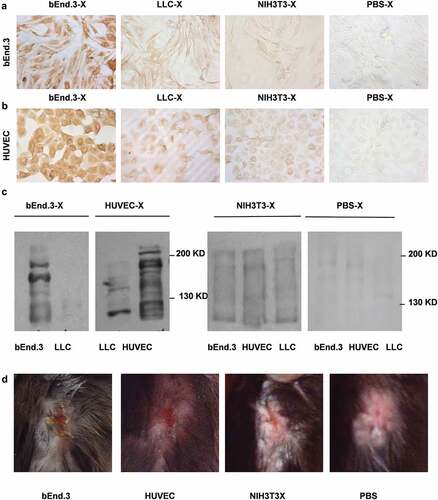
Table 5. Detection of the proliferation ability of autologous lymphocytes stimulated by DCs [n = 8, ) %]
Table 6. Comparison of killing rates of bEnd.3 and HUVEC in target cells by DCs loaded with different antigens [n = 5, () %]
Figure 5. DCs loaded with bEnd.3 antigen inhibited tumor formation and promoted T lymphocyte proliferation. (A) Changes in tumor volume of subcutaneous Lewis lung cancer grafts. There was a significant difference between the NIH3T3 DC group and the DC group (**p < .01). (B) Survival curve of mice. The median survival time of mice in the bEnd.3 DC group was significantly longer than that in the control group (**p < .01). (C and D) Expression of CD3 and CD8 on the surface of T lymphocytes in the spleen of immunized mice
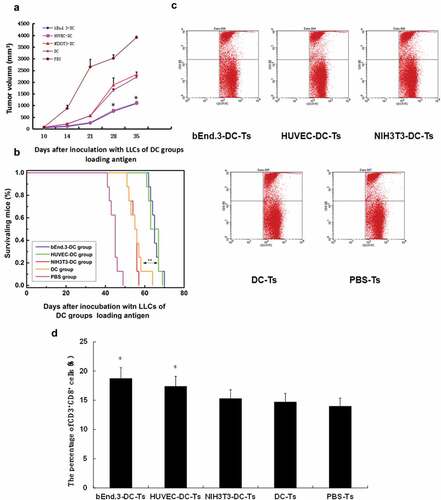
Figure 6. DCs loaded with antigen induced endothelial cell CTL killing activity. (A) Different immune mouse spleen T lymphocytes kill different target cells. bEnd.3DC-T killing activity of bEnd.3 cells and HUVECDC-T killing activity of HUVECs were significantly greater than those of the NIH3T3DC-T, DC-T and PBS-T groups (*p < .05). (B) Specific response of serum antibodies before and after tumor bearing. The bEnd.3DC-T group and HUVECDC-T group were significantly stronger than the NIH3T3DC-T, DC-T and PBS-T groups (*p < .05)
Figure 7. DCs loaded with bEnd.3 antigen induced antibody production in immunized mice. (A and B) Immunocytochemistry was used to detect the specific reaction of anti-serum antibodies in immunized mice. (C) The antiserum antibodies VEGFR-II and integrin αν in mice immunized with C57 were detected by immunoblot