
Figures & data
Table 1. Baseline characteristics of the immunogenicity subgroups (per-protocol set).
Figure 1. Reverse cumulative curves for IgG antibody levels of the different vaccination interval groups (per-protocol set) at month 7. Panel 1A: HPV-16 IgG antibody levels of the three groups with different 1st intervals; Panel 1B: HPV-16 IgG antibody levels of the three groups with different 2nd intervals; Panel 1 C: HPV-18 IgG antibody levels of the three groups with different 1st intervals; Panel 1D: HPV-18 IgG antibody levels of the three groups with different 2nd intervals.
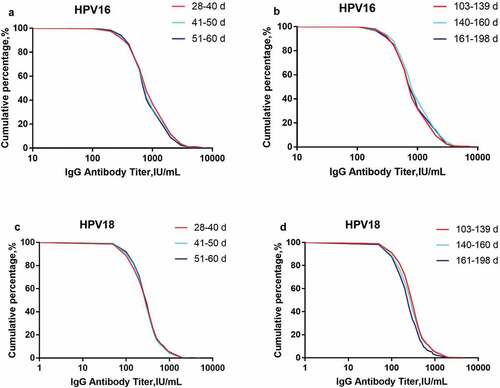
Table 2. Analysis of antibody levels and GMC ratios in the subgroups (per-protocol set).
Supplemental material