Figures & data
Figure 1. Number of publications for IL6 (gray) or IL11 (black) by year (1985–2019). The R package Pubmedwordcloud was used to generate these plots using case insensitive keywords ‘il6ʹ, ‘il-6ʹ, ‘interleukin-6ʹ, ‘interleukin 6ʹ for IL6 and ‘il-11ʹ, ‘interleukin-11ʹ and ‘interleukin 11ʹ for IL11
![Figure 1. Number of publications for IL6 (gray) or IL11 (black) by year (1985–2019). The R package Pubmedwordcloud was used to generate these plots using case insensitive keywords ‘il6ʹ, ‘il-6ʹ, ‘interleukin-6ʹ, ‘interleukin 6ʹ for IL6 and ‘il-11ʹ, ‘interleukin-11ʹ and ‘interleukin 11ʹ for IL11](/cms/asset/db472aa7-8253-4656-8db9-f36a7c42985e/khvi_a_1761203_f0001_b.gif)
Figure 2. IL11RA is expressed on different cell types as compared to IL6R. Graphs showing example data for (a) correlated gene expression (COL1A1 vs COL1A2), (b) unrelated gene expression (COL1A1 vs GAPDH), and (c) IL11RA vs IL6R gene expression, which appears largely exclusive and in disparate cell types. The expression values are normalized counts obtained from the FANTOM consortium.Citation17
![Figure 2. IL11RA is expressed on different cell types as compared to IL6R. Graphs showing example data for (a) correlated gene expression (COL1A1 vs COL1A2), (b) unrelated gene expression (COL1A1 vs GAPDH), and (c) IL11RA vs IL6R gene expression, which appears largely exclusive and in disparate cell types. The expression values are normalized counts obtained from the FANTOM consortium.Citation17](/cms/asset/b59e3e69-c1f0-4dea-a8cb-3b0ba374e484/khvi_a_1761203_f0002_c.jpg)
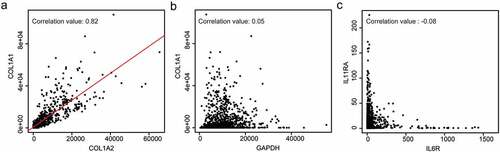
Table 1. Overview of established and hypothetical uses of IL6 or IL11 therapies across organs and diseases