Figures & data
Table 1. Vaccination’s schedule at different groups
Table 2. The utilized primers for Real-Time PCR
Figure 1. Schematic constructions of the multiepitope peptide and DNA vaccines. a) The multiepitope peptide vaccine. b) The multiepitope DNA vaccine
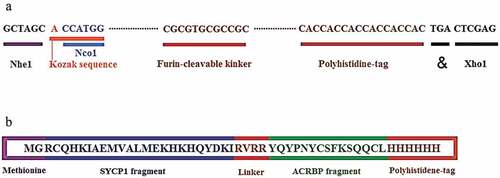
Figure 2. Western blot analysis of the multiepitope peptide vaccine expression by the murine L929 fibroblasts after transfecting with the pcDNA. (a: Ladder, b: Transfected L929, c: Normal L929)
Figure 3. Amplification plots of the SYCP1, ACRBP, and beta-actin mRNAs at 4T1 cells in vitro and in vivo. (a: beta-actin in vivo, b: beta-actin in vitro, c: SYCP1 in vivo, d: SYCP1 in vitro, e: ACRBP in vivo, f: ACRBP in vitro, g, h, and i: negative controls for SYCP1, ACRBP, and beta-actin, respectively)
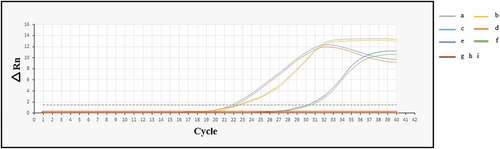
Figure 4. Serum levels of the multiepitope peptide vaccine-specific IgG total, IgG1, and IgG2a isotypes at different groups 2 weeks after the last injection (n = 5). a) IgG1. b) IgG2a. c) IgG total. (*: P < .05, **: P < .005, ***: P < .001, ns: not significant)
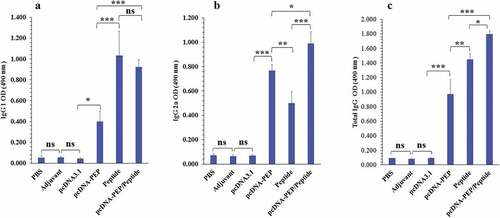
Figure 5. Comparison of the serum levels of the multiepitope peptide vaccine-specific IgG1 and IgG2a in different groups. (*: P ≤ 0.05, ns: not significant)
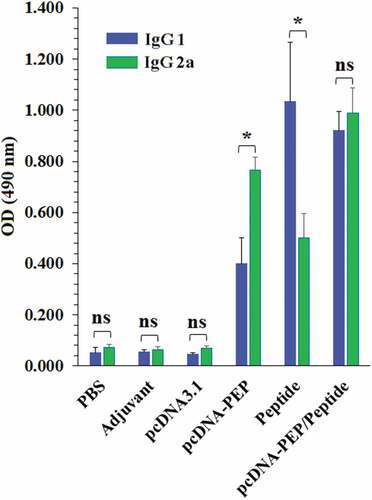
Figure 6. Cytokines’ levels in the culture media of the isolated splenocytes of the immunized mice after stimulation with the peptide vaccine in vitro. a) IL-4. b) IFN-γ. (*:P < .05, **:P < .005, ***:P < .001, ns: not significant)
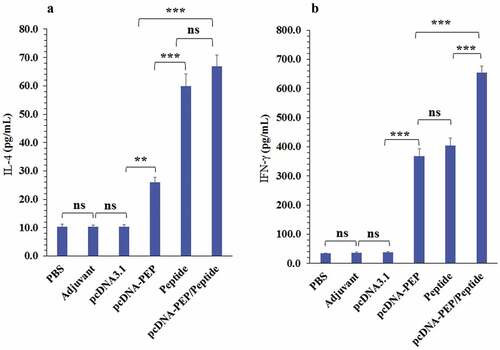
Figure 7. Granzyme B levels in the culture media of the isolated splenocytes of the immunized mice after stimulation with the peptide vaccine in vitro (***: P < .001, ns: not significant)
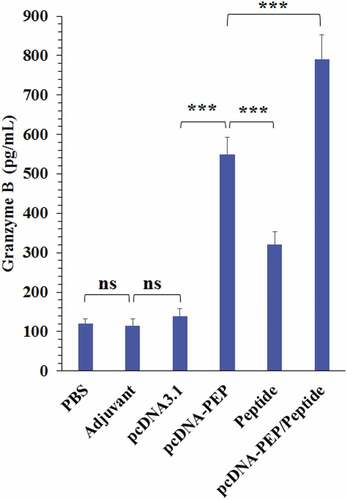
Figure 8. Proliferative responses of the isolated splenocytes of the immunized mice after re-stimulation with the peptide vaccine in vitro (***: P < .001, ns: not significant)
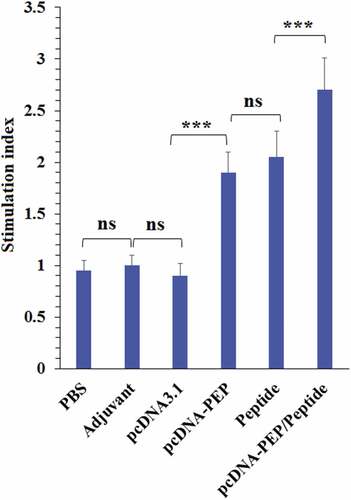
Figure 9. 4T1 breast tumors’ growth progression at different immunization groups (n = 8)
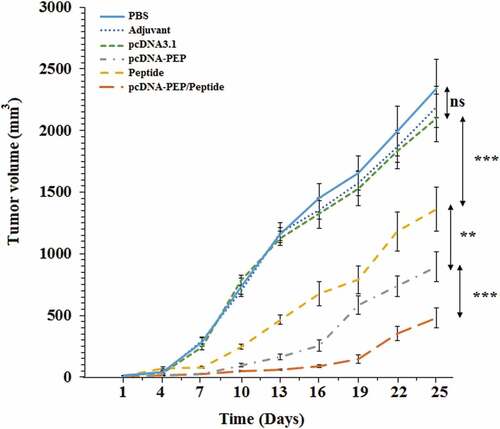
Figure 10. Kaplan-Meier survival curves of the different groups (n = 8) after the cancer cells implantation. (*:P < .05, ns: not significant)
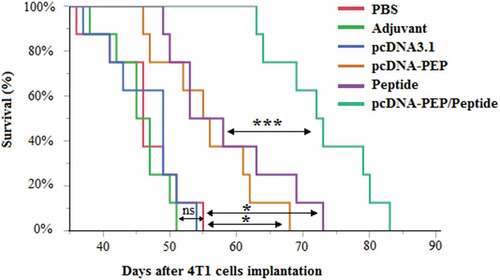
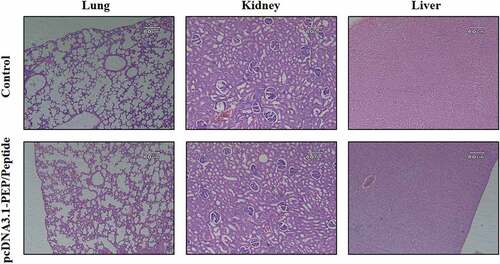
Figure 11. Histopathological investigation of the pcDNA3.1-PEP/Peptide immunization regime effect on the vital organs of non-tumor bearing mice. H&E sections of lungs, kidneys and liver of the mice at the 30th day after the last injection in the control and the pcDNA3.1-PEP/Peptide immunized mice