Figures & data
Figure 1. A. Effect of centrifugation on fluorescence. Assays were performed as described in the Methods section, except that T24 cell numbers were varied as indicated, and appropriately diluted E. coli was added directly to the adhered T24 cells, without a pre-incubation with test or control serum or antibodies. For each T24 cell number, two plates were prepared: one was centrifuged as described in the Methods, and one was not. Plotted here is the ratio of fluorescence from the centrifuged plate to fluorescence from the non-centrifuged plate. N = 2 wells per condition, and error bars represent standard deviation. B. Fluorescence signal as a function of CFU/well. Assays were performed as described in the Methods section, except that appropriately diluted E. coli was added directly to the adhered T24 cells, without a pre-incubation with test or control serum or antibodies. N = 6 or 12 wells per condition, and error bars represent standard deviations. C. Inhibition of fluorescence by mannose with varied CFU E. coli/well. Assays were performed as described in the Methods section, with a range of mannose concentrations. N = 2 wells per condition, and error bars represent standard deviation. D. Inhibition of fluorescence by mannose or rabbit anti-FimH. Assays were performed as described in the Methods section, with varied incubation time of E. coli with inhibitor. N = 6 (30 min and 120 min incubations) or 12 wells (controls, 60 min inubations) per condition, and error bars represent standard deviation. Two replicate plates were run on two separate days; data from one representative plate are shown
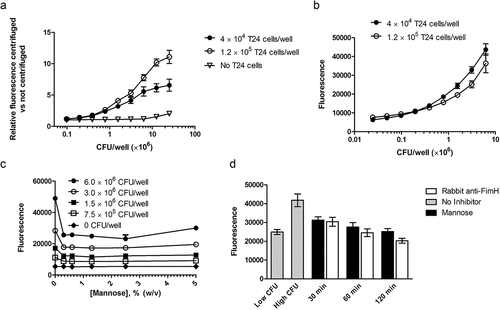
Figure 2. A. Inhibition of binding by rabbit serum. Serum was collected from a single rabbit before and 4 weeks after immunization with the FimCH vaccine. The assay was performed as described in the Methods section. Low CFU wells contained 3 × 10⁶ CFU/well; all others contained 6 × 10⁶ CFU/well. Two replicate plates were run on two separate days; data from one representative plate are shown. N = 6 wells per condition, and error bars represent standard deviation. The RSDs of the average fluorescence signals on each plate were ≤12%. B. Inhibition of binding by purified human anti-FimH IgG. Low CFU wells contained 3 × 10⁶ CFU/well; all others contained 6 × 10⁶ CFU/well. Two replicate plates were run on two separate days; data from one representative plate are shown. N = 6 wells per condition, and error bars represent standard deviation. The RSDs of the average fluorescence signals were <12%. C. Effect of heat inactivation of serum on fluorescence. Assays were performed as described in the Methods section, except that heat inactivation time varied. Low CFU wells contained 3 × 10⁶ CFU/well, and mid CFU wells contained 4.5 × 10⁶ CFU/well; all others contained 6 × 10⁶ CFU/well. Serum taken from one subject before and after vaccination were assayed after 0, 1, or 2 h heat inactivation. N = 6 wells per condition, and error bars represent standard deviation
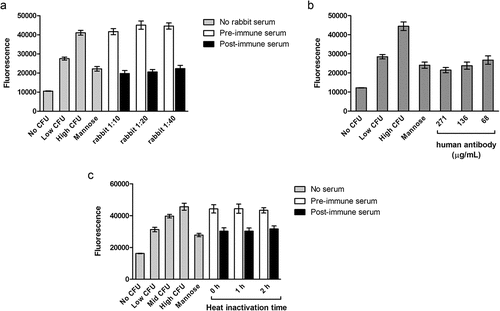
Figure 3. Inhibition of E. coli binding by anti-FimH sera from immunized humans with a history of urinary tract infections. Pre-immune sera were collected prior to the first vaccination, and post-immune sera were collected 30 days after the fourth vaccination. Serum from subjects 101–6004, 102–6005, and 103–6001 were each tested on two separate days as noted in the graph titles. N = 6 wells per condition, and error bars represent standard deviation
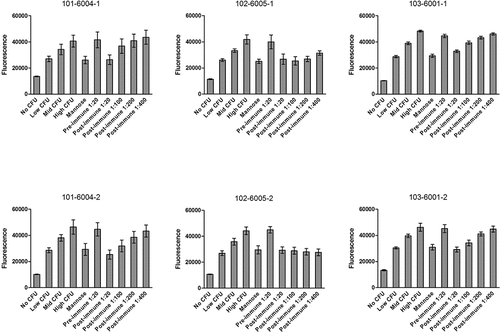
Figure 4. Plate Map 1 (upper) and Plate Map 2 (lower). Each plate contains Serum from a single patient plus bacterial controls and mannose controls
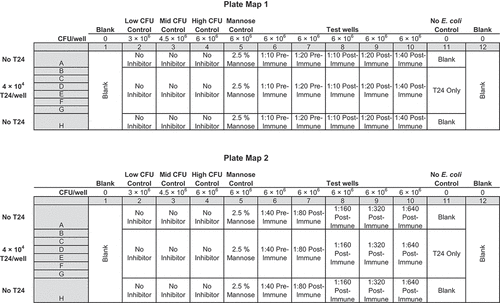
Table 1. Fluorescence as a function of concentration of rabbit anti-FimH IgG RS (reference standard) spiked into a pool of normal human sera. The full range of spiking concentrations were measured across two assay plates
Table 2. Selectivity and Specificity; rabbit anti-FimH IgG spiked at 100 µg/mL into a range of dilutions of NHS
Figure 5. Fluorescence as a function of concentration of rabbit anti-FimH IgG RS (reference standard) spiked into a pool of normal human sera. Individual values are shown in Table 1
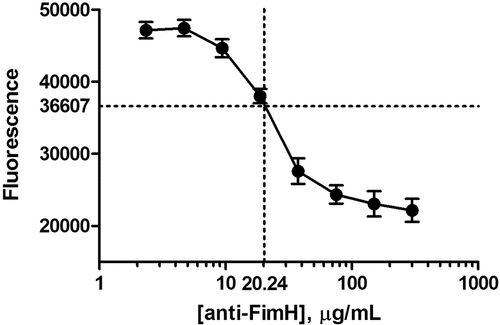
Table 3. Intra-Assay Precision; average, SD, and RSD across replicate wells within a single plate
Table 4. Inter-Assay Precision; average, SD, and RSD of results from three different plates
Table 5. Dilutions of Sera from FimH-Immunized Humans that Inhibit the Adherence of E. coli to Human Bladder Cells
