
Figures & data
Table 1. Assignment of children to vaccination cohorts according to date and region of birth
Table 2. Yearly incidence (per 100,000 person-years) of otitis media/acute otitis media among all children according to age*
Table 3. Overall incidence per 100,000 person-years of otitis media/acute otitis media in the pre-PCV, PCV7, and PHiD-CV/PCV13 cohorts*
Figure 1. Time-series showing monthly incidence of otitis media/acute otitis media (OM) in the pre-PCV, PCV7, and PHiD-CV eras in Skåne
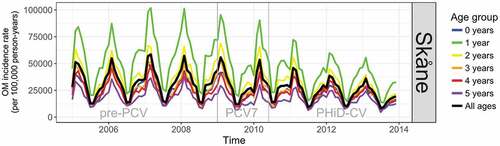
Figure 2. Time-series showing monthly incidence of otitis media/acute otitis media (OM) in the pre-PCV, PCV7, and PHiD-CV eras in VGR
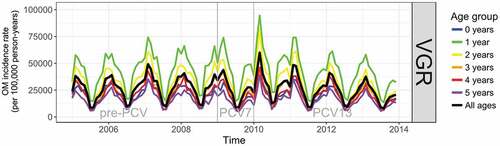
Table 4. Incidence rate ratios of otitis media/acute otitis media diagnoses between vaccine cohorts adjusted for confounding variables, according to the age-period-cohort Poisson model