Figures & data
Figure 1. Selection process for articles used in the meta-analysis
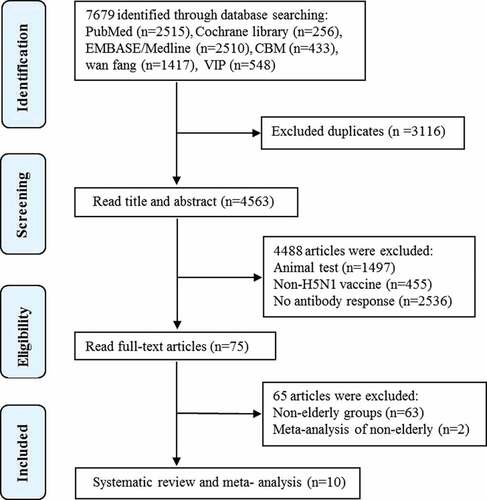
Table 1. Characteristics of included trials
Figure 2. Summary of risk of bias. Plus signs, yes (low risk of bias); minus signs, no (high risk of bias); question marks, results unclear (unclear risk of bias)
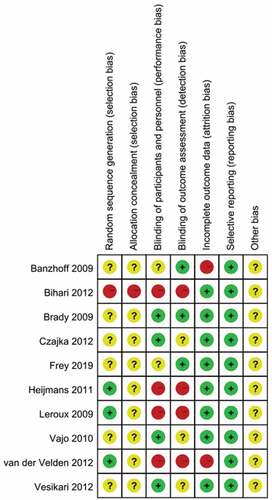
Table 2. Differences in the SCR and SPR resulting from a single dose and two doses
Figure 3. The differences in the SCR and SPR between different doses of the two-dose vaccines. The differences in the SCR (a) and SPR (b) of antibodies were analyzed between adjacent dosages of the two-dose adjuvanted H5N1 vaccines
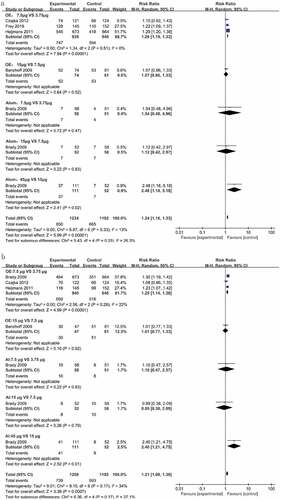
Table 3. Pooled SCR and SPR of antibodies to two-dose vaccines with different adjuvants
Figure 4. Differences in the SCR and SPR between younger and elderly adults. The differences in SCR (a) and SPR (b) for antibody responses to two doses of OE-adjuvanted H5N1 vaccines were analyzed between younger and elderly adults