
Figures & data
Table 1. Diagnosis at admission. Data are shown as a number of cases (%)
Figure 1. Pertussis cases by year and season. Number of children hospitalized by year and season from 2011 to 2018
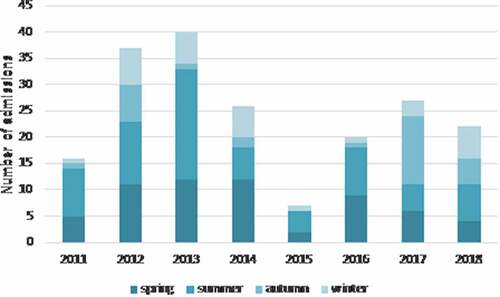
Figure 2. Pertussis cases by month. Average number of children hospitalized each month from 2011 to 2018. Error bars show standard deviation
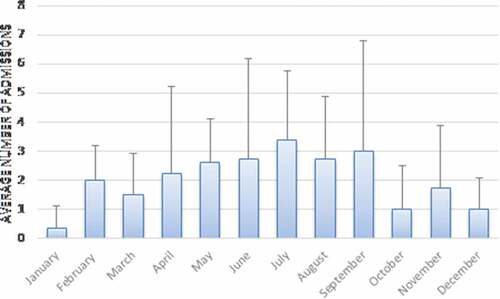
Table 2. Demographic, clinical, and laboratory data of study patients. Data are shown as the number of cases (%) or mean (± SD). Percentages may not equal 100, because of rounding
Table 3. Vaccination status of patients according to age. Data are shown as the number of cases (%)
Figure 3. Length of hospital stay in different ages. The box shows the median, the lower and the upper quartiles, while the whiskers indicate the lowest and the highest data point excluding any outliers. The circles indicate outliers
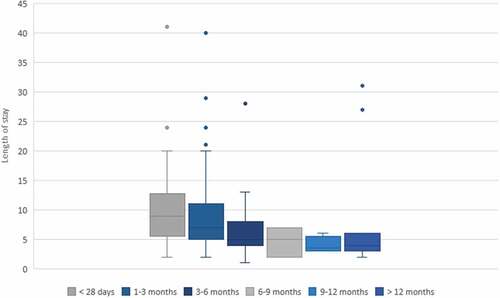
Table 4. Demographic, clinical, and laboratory data of patients infected by B. pertussis only and with viral coinfections (RV, respiratory virus). Data are shown as the number of cases (%) or mean (± SD)
Table 5. Demographic, clinical, and laboratory data of ward vs PICU group. Data are shown as number of cases (%) or mean (± SD)