Figures & data
Table 1. Demographic and baseline characteristics of all enrolled subjects
Figure 1. Flow of subjects in the study
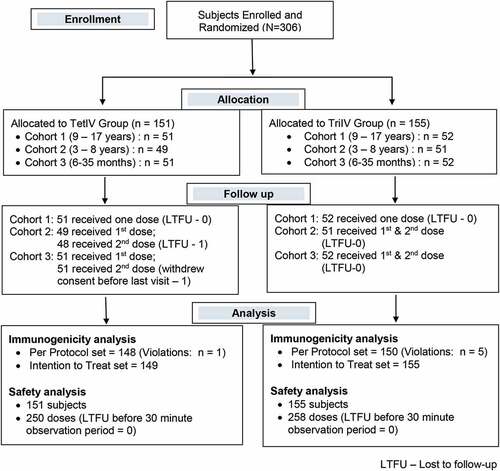
Table 2. Seroconversion and seroprotection rates, and GMTs in the two groups, 28 days after the last vaccination
Table 3. Seroconversion rate 28 days after the last vaccination in the three cohorts
Table 4. Seroprotection rate 28 days after the last vaccination in the three cohorts
Table 5. Geometric Mean Titer 28 days after the last vaccination in the three cohorts
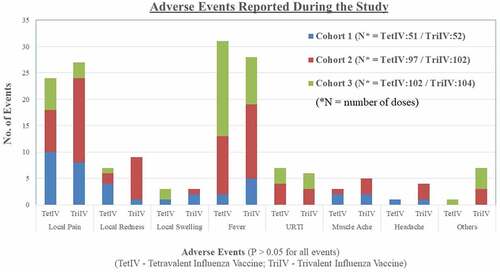
Figure 2. Adverse events reported post influenza vaccination