
Figures & data
Figure 1. A comparative illustration of healthy and infected alveolus due to Acute Respiratory Distress Syndrome (ARDS). The Figure was created with “BioRender.com” template and exported under the terms of premium subscription
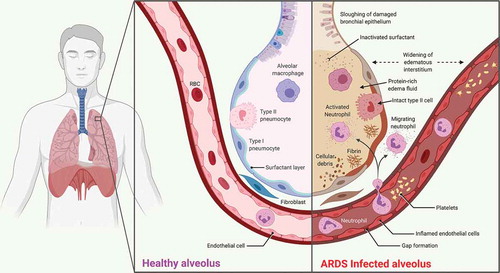
Figure 2. A stepwise illustration of COVID-19 serologic diagnostic test through antibody detection. The Figure was created with “BioRender.com” template and exported under the terms of premium subscription
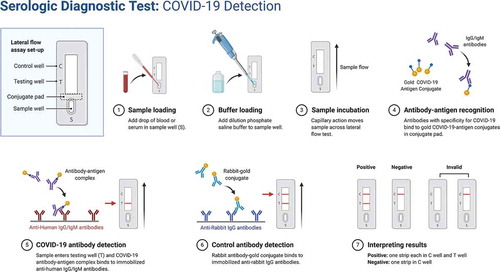
Table 1. Overview of vaccine production platforms and vaccine candidates for various Coronaviruses