
Figures & data
Table 1. Epidemiologic inputs used in cost-effectiveness analysis
Table 2. Cost, utility and case fatality parameters used in cost-effectiveness analysis
Figure 1. Incidence of IPD today and in 5 and 10 years from now given a PCV10 and PCV13 vaccination policy in individuals aged 0 to 2 years and ≥65 years
Figure 1 presents the impact of an infant vaccination program with PCV10 and PCV13 in individuals aged 0 to 2 years (Figure 1a) and those 65+ (Figure 1b) in Korea at the time of switch and over the next 5 and 10 years. PCV10, 10-valent pneumococcal conjugate vaccine; PCV13, 13-valent pneumococcal conjugate vaccine.
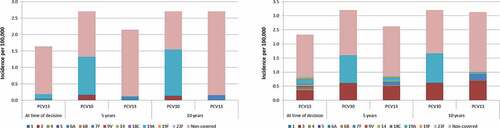
Table 3. Prospective impact of a PCV13 or PCV10 NIP over 5 years
Table 4. Scenario analyses of a PCV13 NIP compared with a PCV10 NIP in South Korea
Figure 2. One-way sensitivity analysis: PCV13 versus PCV10 incremental cost per quality-adjusted life-year
Figure 2 presents the results of the one-way sensitivity analysis for PCV13 versus PCV10. Red-shaded bars represent the incremental cost-effectiveness ratio at the upper bound of the input parameter estimate, and blue-shaded bars represent the incremental cost-effectiveness ratio at the lower bound of the parameter estimate.
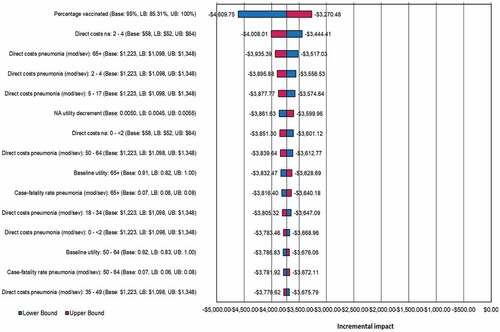
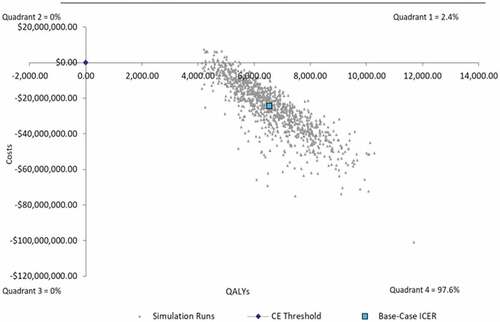
Figure 3. Probabilistic sensitivity analysis for Base Case Analysis
Figure 3 presents the results of a first-order Monte Carlo simulation with 1000 simulations. Gray dots represent the incremental cost and QALY results for each of 10,000 iterations of the simulation. The blue square represents the base case incremental cost and QALY estimate. ICER, incremental cost-effectiveness ratio; QALYs, quality-adjusted life-years.
Supplemental material