Figures & data
Figure 1. Phylogenetic relationship of CoVs. The phylogenetic tree illustrates the relationship among some HCoVs (red) and animal CoVs (blue) as a reference used in the tree, on the basis of complete genome nucleotide sequences. The viruses are grouped and subgrouped as (prototype shown): Alpha-CoV (pink, subgroup;1a,1b), Beta-CoV (light brown, subgroup; 1a,1b,1 c,1d), Gamma-CoV (light blue), and Delta-CoV (green). This tree is reconstructed with RNA-dependent RNA polymerase-coding region complete sequences of CoVs (with MEGA 7.2 software for maximum likelihood method).Citation24 Porcine enteric diarrhea virus (PEDV); infectious bronchitis virus (IBV); SARS- CoV; transmissible gastroenteritis virus (TGEV) MERS- CoV; Porcine respiratory CoV ISU-1 (PRCV ISU-1); and Wuhan seafood market pneumonia (Wuhan-Hu-1)
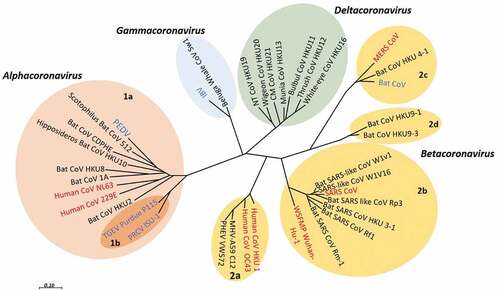
Figure 2. Transmissions cycle of SARS-CoV, MERS-CoV, and SARS-CoV-2
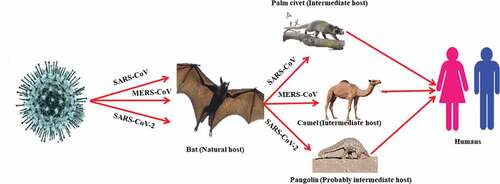
Figure 3. Proposed replication cycle of SARS-CoV-2
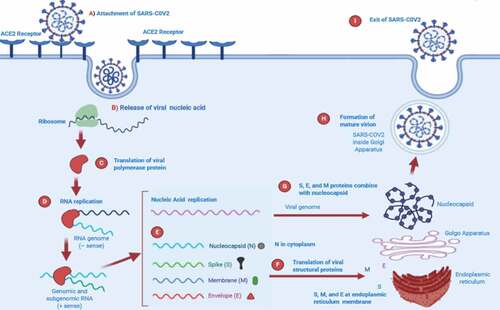
Table 1. Trend of COVID-19 cases in China (01–22-2020 to 04–03-2020)
Table 2. Membership function
Figure 4. Plithogenic representation of COVID-19 cases in China from 01/22/2020 to 03/04/2020
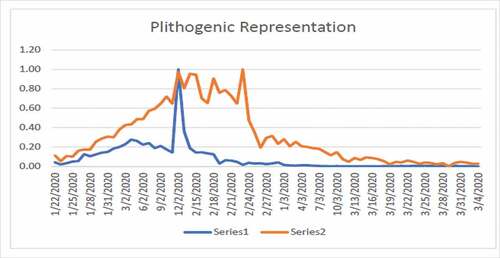
Figure 5. Number of infected person from COVID-19 in China
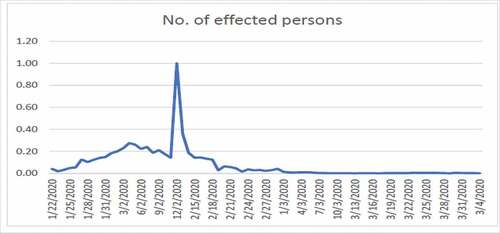
Figure 6. Death rate due to COVID-19 in China
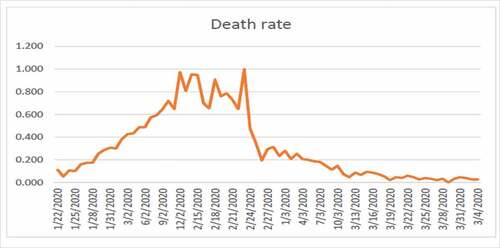
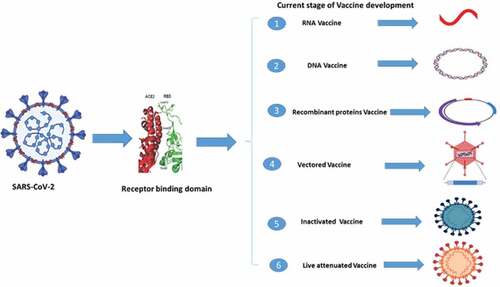
Figure 7. Different strategies of vaccine development against SARS-CoV-2