Figures & data
Figure 1. PCV introduction and study analysis time period
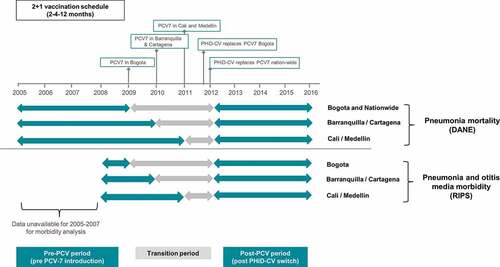
Table 1. % reductions in all-cause pneumonia mortality and overall all-cause mortality in post-PCV period compared to pre-PCV introduction period in children <2 y by vaccine period in selected cities and nationwide
Figure 2. Annual mortality due to all-cause pneumonia (a) and annual all-cause mortality (b) in children <2 y of age (2005–2016)
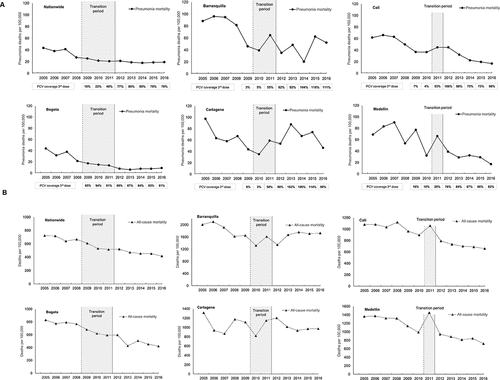
Table 2. Percentage reductions in all-cause pneumonia incidence and otitis media incidence in post-PCV period compared to pre-PCV introduction period in children <2 y by vaccine period in selected cities
Figure 3. Annual incidence of pneumonia and otitis media in children <2 y of age (2008–2016)
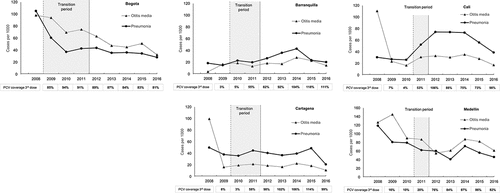
Figure 4. PCV vaccination coverage across the study period (2009–2016)
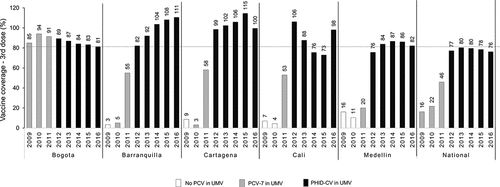
Figure 5. Reductions in all-cause pneumonia and otitis media
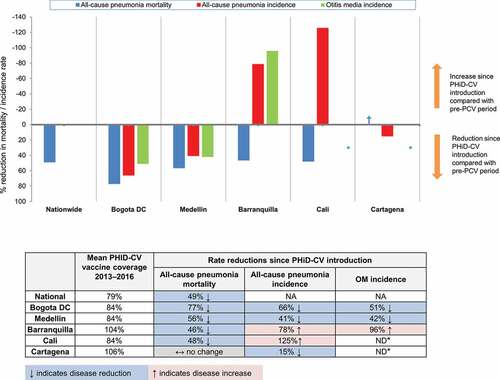
Figure 6. Focus on the patient