
Figures & data
Figure 1. Decision-Markov model of universal vaccination and nonvaccination program
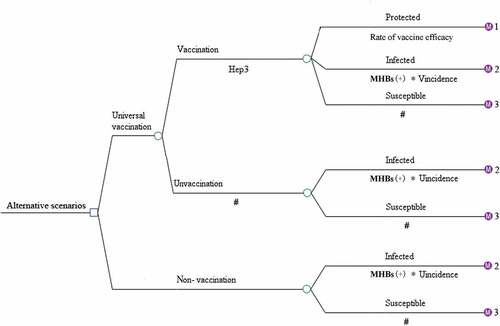
Figure 2. Prognosis of HBV-infected infants
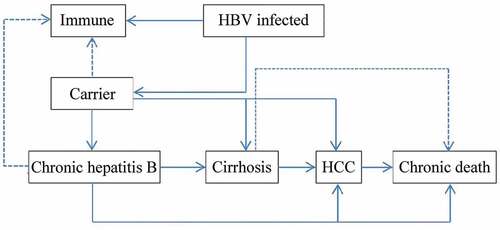
Figure 3. Prognosis of HBV-susceptible infants
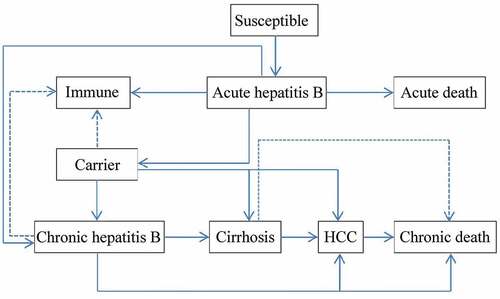
Table 1. Parameters of decision-Markov models
Table 2. Average cost and QALYs gains and ICUR of two scenarios
Table 3. Direct treatment cost and QALY loss of HB-related patients under different scenarios
Figure 4. Incremental cost-utility plane for vaccination vs. nonvaccination from healthcare perspective of 5000 simulations
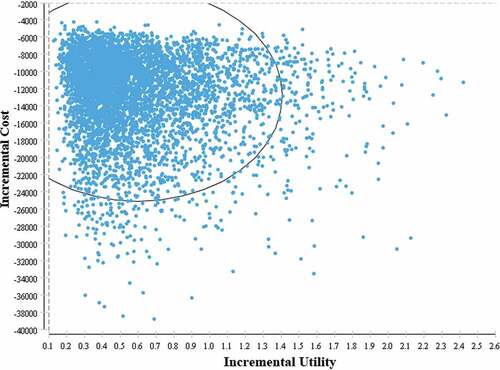
Table A1. Characteristics of socio-demographic variables of HB-related patients in 2016
Figure A1. Selective standard of out/inpatients from beijing health and medical price monitoring data platform
Table A2. Death rate data of 1% of population in 2015 in Beijing
Table A3. Direct treatment cost in 2016 in Beijing (CNY)