
Figures & data
Figure 1. Participant flow chart
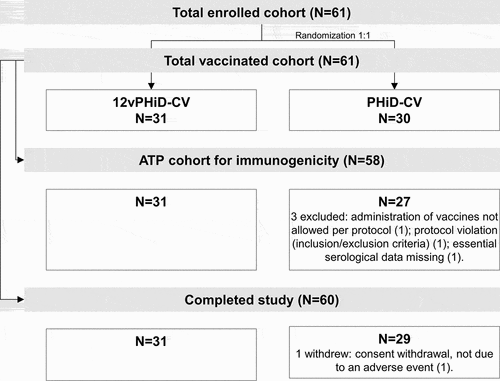
Table 1. Demographic characteristics for study participants (total vaccinated cohort)
Figure 2. Percentage of toddlers with solicited local (A) and general (B) adverse events within the 7-day period following vaccination (total vaccinated cohort)
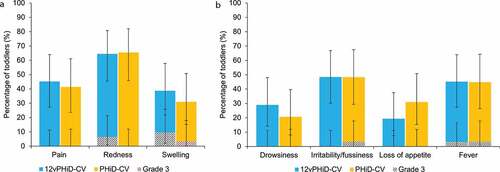
Table 2. Percentages of toddlers with pneumococcal serotype-specific antibody concentrations ≥0.2 µg/mL and antibody GMCs, by timepoint (according-to-protocol cohort for immunogenicity)
Table 3. Percentages of toddlers with pneumococcal serotype-specific OPA titers above or equal to the assay serotype-specific LLOQ and OPA GMTs, by timepoint (according-to-protocol cohort for immunogenicity)
Table 4. Percentages of toddlers with anti-protein D antibody concentrations ≥100 EL.U/mL and antibody GMCs, by timepoint (according-to-protocol cohort for immunogenicity)