Figures & data
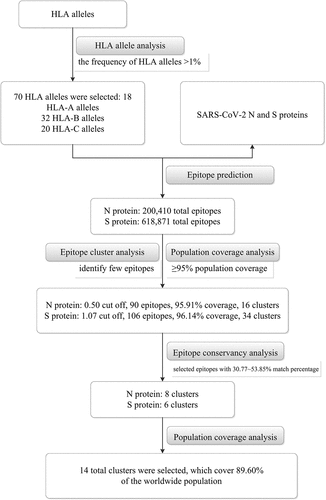
Table 1. List of 70 HLA alleles (18 HLA-A alleles, 32 HLA-B alleles, 20 HLA-C alleles) selected occurring in at least 1% of the human population
Table 2. The epitopes number, cluster numbers, and population coverage results of the predicted SARS-CoV-2 N and S proteins
Table 3. The epitopes sequences, amino acid position and its presented HLA alleles of SARS-CoV-2 N protein by cluster analysis
Table 4. The epitopes sequences, amino acid position and its presented HLA alleles of SARS-CoV-2 S protein by cluster analysis
Table 5. The results of comparing N and S protein of SARS-CoV-2 with Bat coronavirus and other human coronaviruses (SARS, MERS, HCoV-OC43, HCoV-HKU1, HCoV-229E and HCoV-NL63)
Table 6. The epitope conservancy analysis results for N protein among the 13 coronaviruses
Table 7. The epitope conservancy analysis results for S protein among the 13 coronaviruses
Table 8. The epitope sequences and its presented HLA alleles of the 14 combination epitopes
Table 9. The population coverage results (%) of the 14 combination epitopes

