
Figures & data
Table 1. Principal Component Analysis (PCA): correlations between questions and components (factors) after Varimax rotation. VL functional questionsCitation1–Citation4 and interactive-critical questionsCitation5–Citation12 loading on two different components (Factor 1 and Factor 2): values in bold correspond for each variable to the factor for which the correlation was the greatest
Figure 1. Principal Component Analysis (PCA): correlation circle between questions and components after Varimax rotation. Projection of the functional VL questions (Q1–Q4) and the interactive-critical VL questions (Q5–Q12) on two components (Factor 1 and Factor 2), representing 49.49% of the total variability. Variables close to each other were significantly positively correlated
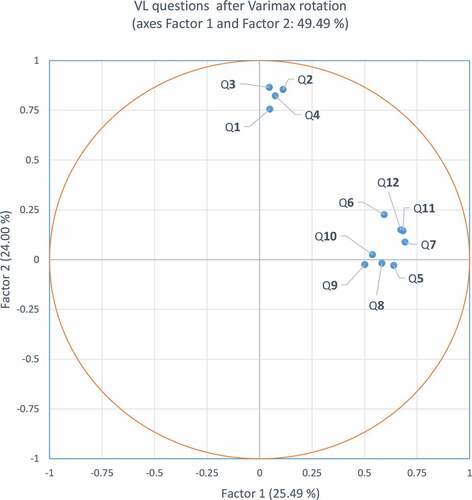
Table 2. Main demographic characteristics of the participants
Table 3. VL functional and interactive-critical scores of the total, male, and female populations
Figure 2. Observed functional Vaccine Literacy (VL) scores, visualized as mean and 95% C.I. (error bars), according to age groups
Figure 3. Observed interactive-critical Vaccine Literacy (VL) scores, visualized as mean and 95% C.I. (error bars), according to age groups
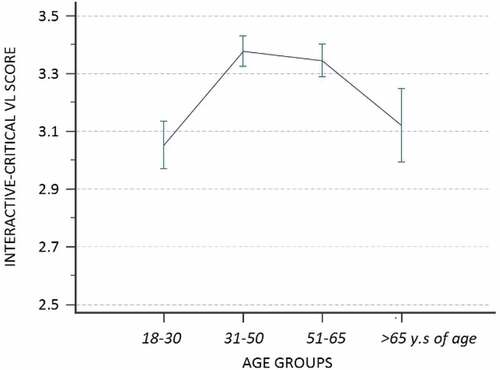
Table 4. Positive and negative attitudes/perceptions about future COVID-19 vaccines and behavior toward current vaccines, and significance level of their association with vaccine literacy (VL) scores, age, and gender (significant values in bold)
Table 5. Spearman rank correlation coefficients (r) and significance levels between ordinal and ordinal/numerical variables observed in the survey (significant P values in bold)