
Figures & data
Figure 1. Model diagram
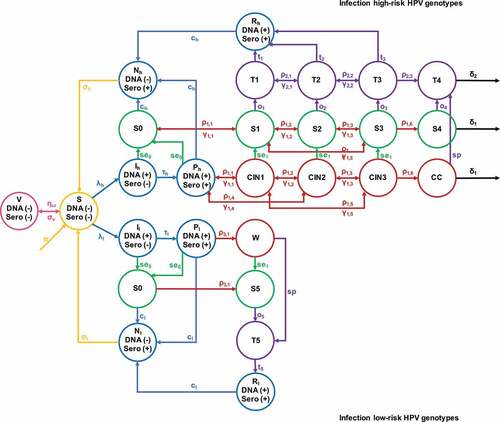
Figure 2. Temporal projection of the HPV epidemic among Chinese women aged >25, with (a–f) qHPV schoolgirls vaccination program only; (g–l) scale-up cervical cancer screening only, 2020–2069
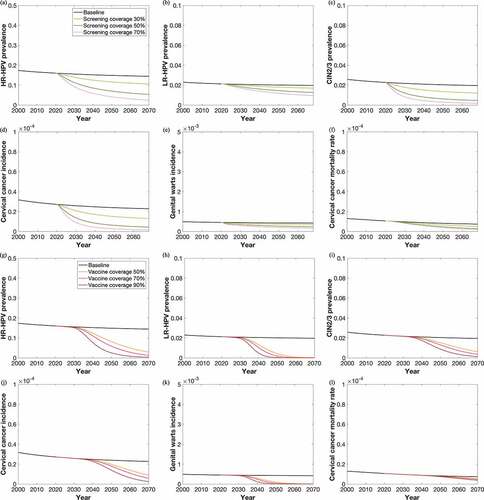
Figure 3. Two-dimensional cost-effectiveness plane demonstrating the distribution of 1,000 simulations for incremental cost and DALYs prevented under intervening strategies with different vaccine prices. (a–c): single intervention with qHPV at different price levels; (d)-(f) 50% vaccination with scale-up screening strategies; (g–i): 90% vaccination with scale-up screening strategies
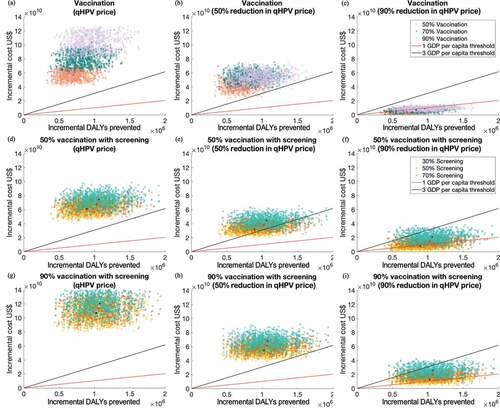
Table 1. Cost-effective analysis of qHPV vaccination and screening strategies with a 50-year forecast, 2020 – 2069
Supplemental material