
Figures & data
Table 1. Primers used in this study
Figure 1. Characterization of the LM4Δhly::E7-1 strain
The culture supernatant of LM4Δhly::E7-1 was precipitated by TCA. a. Coomassie staining of secreted LM protein extracts obtained from LM4Δhly, LM4Δhly::E7-1 and LM4Δhly::E7. Equal loading of proteins was ascertained with the Coomassie brilliant blue R-250 staining (10 µg/well). b. Western blotting of the secreted proteins extracts obtained from LM4, LM4Δhly::E7-1 and LM4Δhly::E7. Immunoblots showing a reaction with anti-E7 antibodies. M, protein marker. Lane 1, LM4Δhly. Lane 2, LM4Δhly::E7-1. Lane 3, LM4Δhly::E7. Positions of the relevant molecular mass markers are given to the left in kDa.
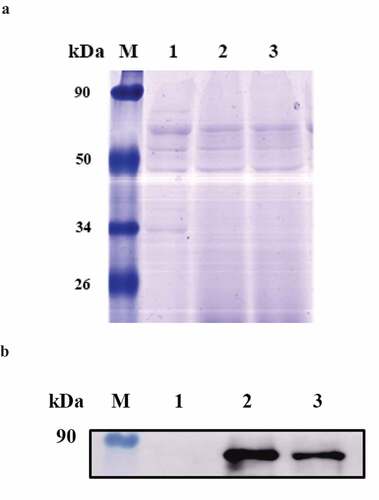
Figure 2. Hemolytic activity of the recombinant strain was detected
The culture supernatants of LM4, LM4Δhly::E7-1 and LM4Δhly::E7 were two-fold serially diluted, 1% sheep blood cells were added and incubated at 37°C for 1 h.
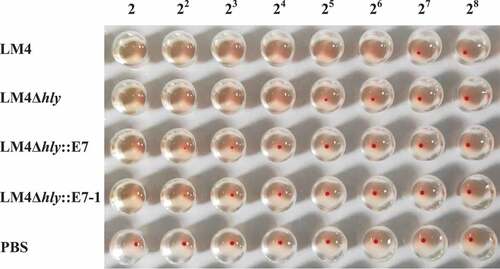
Figure 3. Growth curves and infection kinetics in the liver and spleen of LM4Δhly::E7-1
(a). Growth curves of LM4Δhly::E7-1. Overnight culture bacteria were diluted in 10 mL BHI (OD600 = 0.05), and cultured at 37°C 180 rpm. For each time point, measured OD600 values represent the mean ±SD of three independent experiments. (b, c). Infection kinetics in organs of mice immunized with LM4Δhly::E7-1. Three groups of C57BL/6 mice were intraperitoneally inoculated with 3 × 10⁸ CFU bacteria of LM4Δhly∷E7-1, LM4Δhly∷E7 and 2 × 10⁵ CFU of LM4Δhly respectively. Livers and Spleens were extracted and homogenized on 1 d, 3 d, 5 d and 7 d after each immunization. Homogenates were diluted with PBS buffer and plated on BHI agar to determine bacterial numbers. CFU/organ was calculated on 1 d, 3 d, 5 d and 7 d after each immunization, and infection kinetics in the organs are shown. Error bars represent SD, data represent two independent experiments. Statistical analyses were carried out by Tukey’s multiple comparisons test: *P < .05, ****P < .0001. d. Histologic analysis of LM4Δhly::E7-1. Mice were intraperitoneally immunized with LM4Δhly, LM4Δhly::E7, LM4Δhly::E7-1 and PBS buffer. Tissue sections of mouse liver and spleen were prepared by standard techniques at days 7 after the second immunization. All sections were examined by light microscopy under a 400-fold.
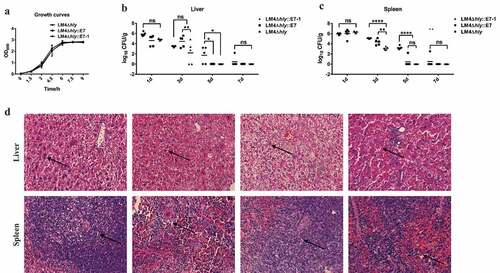
Figure 4. Enhanced stronger Th1-type immune response elicited with E7 Codon-optimization
Groups of five mice were intraperitoneally immunized with LM4Δhly, LM4Δhly::E7, LM4Δhly::E7-1 and PBS buffer. On days 7 after the second immunization, E7-specific cellular immunity was analyzed in immunized mice. (a, b). The level of secreting IFN-γ and IL-4 in the harvested splenocytes, assessed by sandwich ELISA. (c). Lymphocyte proliferation assay of different groups. Error bars represent SD, n = 3 independent experiments. Statistical analyses were carried out by Tukey’s multiple comparisons test: *P < .05, ***P < .001, ****P < .0001, ns: no significance.
Figure 5. E7-specific CTL activity of different mice group
Data representative of the E7-specific CTL response in vivo. Data are expressed as the mean and s.d. values from three independent experiments. Statistical significance determined with Student’s t-test: *P < .05. ns: no significance.
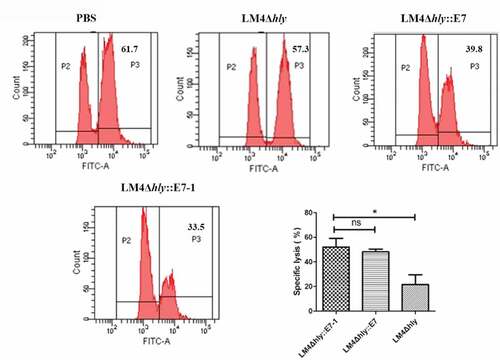
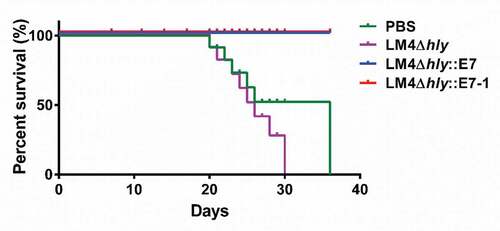
Figure 6. Survival curves of tumor-bearing mice
Groups of eight mice were subcutaneously injected with TC-1 cells. Mice were intraperitoneally immunized with LM4Δhly, LM4Δhly::E7, LM4Δhly::E7-1 and PBS buffer. One week later, mice were given a booster immunization, and the survival of mice were observed continuously for 36 day.
Supplemental material