Figures & data
Table 1. Summarizes the proportion of protective antibody of pertussis, diphtheria and tetanus antibodies among subjects by age group, gender, and residence place group
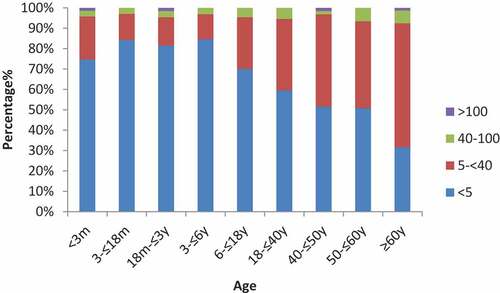
Figure 1. The distribution of anti-DT IgG level in the sera of subjects among different age groups different color bar represent different antibody level
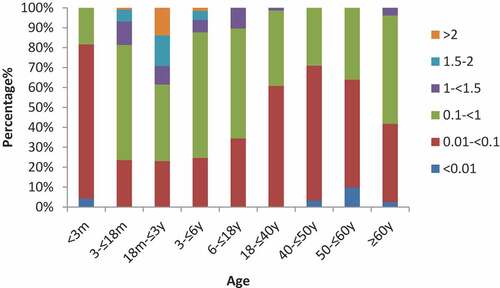
Figure 2. The distribution of anti-TT IgG level in the sera of subjects among different age groups, different color bar represent different antibody level
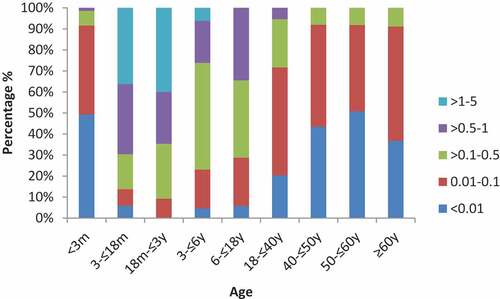
Figure 3. The distribution of anti-PT IgG level in the sera of subjects among different age groups, different color bar represent different antibody level