
Figures & data
Figure 1. Scatter plot for birth week and birthweight
Note: A strong correlation was found between birth week and birthweight, with a Pearson Correlation coefficient r = 0.621.
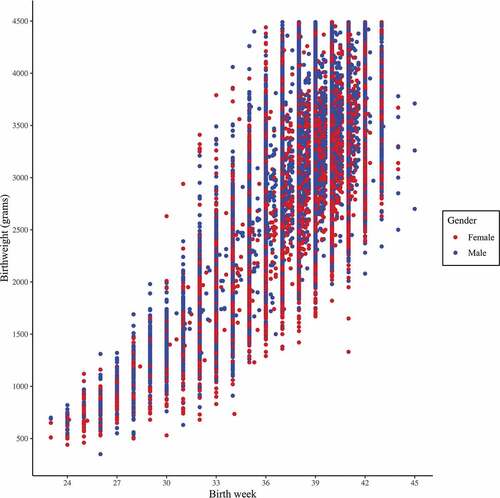
Table 1. General characteristics of the 2016 birth cohort, Israel
Figure 2. Cumulative proportion of first dose of DTaP-IPV-Hib vaccine uptake by child’s age in days in NBW and LBW children born in 2016 and followed up to 24 months, Israel
Note: The curves show the cumulative proportion of children vaccinated for first dose of DTaP-IPV-Hib over time. The vertical lines represent the day at which vaccination uptake reached 90% and 95% within each age group.
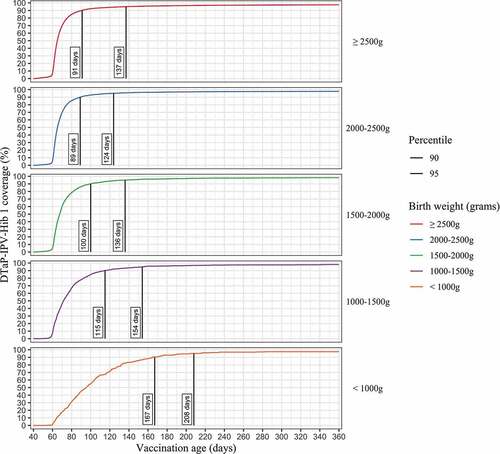
Figure 3. Distribution of vaccination timing by defined categories (status at the age of 24 months) for selected vaccine doses, in children born in Israel, 2016
Abbreviations: DTaP-IPV-Hib 1, diphtheria, tetanus, acellular pertussis, polio, Haemophilus influenzae B vaccine, first dose.
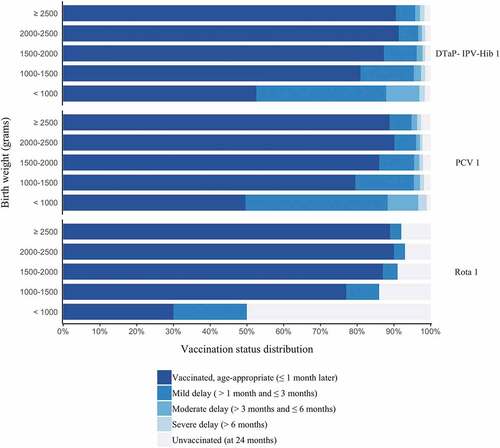
Figure 4. Forest plot presenting OR for risk of vaccination delay among NBW and LBW infants
Note: In early infancy LBW children are at a higher risk of vaccination delay (vaccine dose administered more than 30 d after required age), compared to NBW weight. The risk for later doses within each series is generally lower as doses progress. In some cases, vaccinations administered at older ages and not limited by earlier doses from a series show an advantage among LBW infants. Abbreviations: NBW, normal birthweight (≥2500 g); LBW, low birthweight (<2500 g).
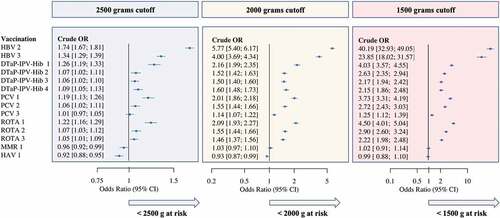
Table 2. Multiple logistic regression model, dependent variable – DTaP-IPV-Hib 1 – age-appropriate vaccination status.a